
Site Analysis Tools for Architects (2026): ArchiKEK, Forma, QGIS and What Works in India
From figure-ground maps to sun, wind and noise studies: what today's site-analysis tools actually do, which data exists for an Indian plot, and how to put a defensible site analysis together.
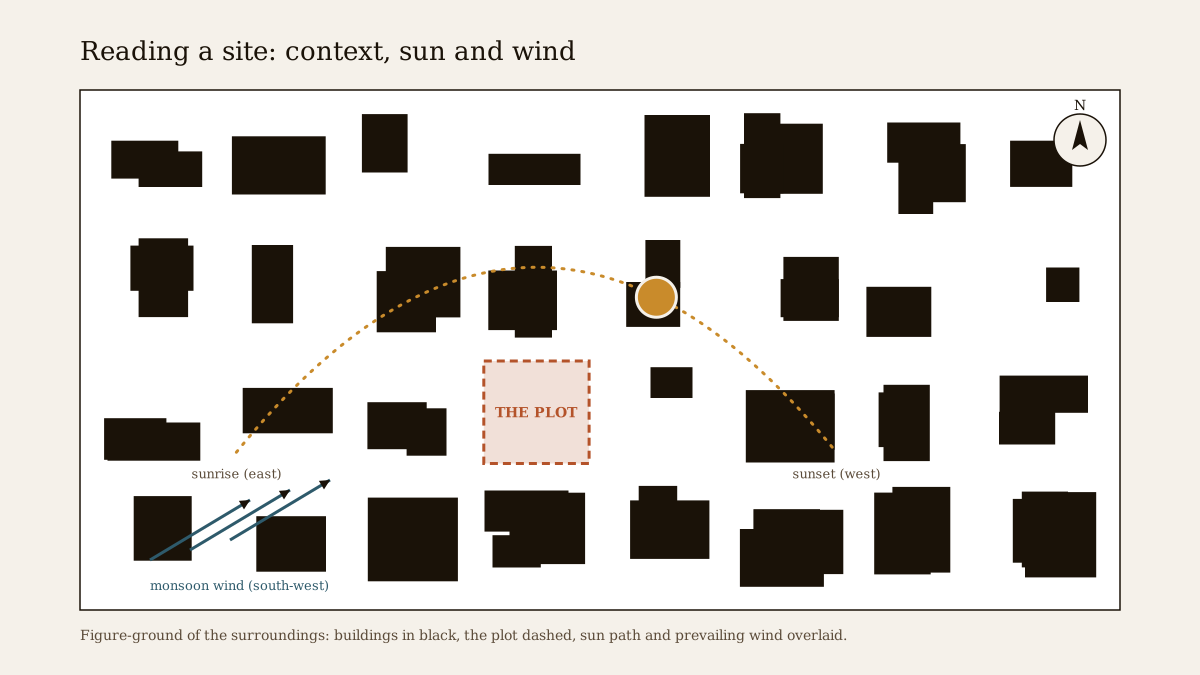
Every good building starts with reading the land it stands on. A site analysis records what the plot already gives you, and what it takes away: the sun and the wind, the roads and the neighbours, the slope, the soil, the views, the noise, the rules. For most of architecture's history this meant a notebook, a measuring tape, a compass and many hours redrawing survey maps by hand.
In 2026 a handful of tools promise to do much of that in minutes. Some draw a map of the surroundings for you. Some simulate sun, wind and noise on a massing model. Some are full geographic information systems. This guide explains what each one really does, what it costs where the price is published, and, most importantly for Indian practice, which data actually exists for a plot in India and which data you will only get by walking the site.
This guide describes third-party software as of November 2026. Versions, features and prices change often; where a figure comes from the vendor's own material it is marked as a vendor claim. Studio Matrx has no commercial relationship with any company named here.
What a site analysis must answer
Before choosing tools, be clear about the questions. A site analysis for a house, a school or a small office in India usually has to answer the same dozen:
| Question | Why it matters | Typical source |
|---|---|---|
| Where exactly is the plot, and what are its dimensions? | Everything else hangs on the boundary | Sale deed sketch, survey, cadastral map, site measurement |
| What may be built here? | Zone, FAR or FSI, setbacks, height | Master plan, local bye-laws, the planning authority |
| Where does the sun rise and set, and how high does it climb? | Orientation, shading, heat gain | Sun-path diagram for the latitude |
| Where does the wind come from, season by season? | Cross-ventilation, rain direction | Climate data, local observation |
| What surrounds the plot? | Overlooking, shadows cast by neighbours, access | Maps, satellite images, site photographs |
| How does the land fall? | Drainage, plinth level, cut and fill | Contour survey or levels |
| What is the soil like? | Foundation type and cost | Soil investigation by a geotechnical engineer |
| Where are water, sewer and power? | Connection points and cost | Utility offices, site visit |
| Is it prone to flooding or waterlogging? | Plinth height, basement decisions | Local knowledge, authority records, site visit |
| What can be seen and heard? | Views to frame or screen, noise to block | Site visit at different times of day |
| What does the street and neighbourhood feel like? | Entrances, privacy, character | Walking the area |
| What rules sit on top of zoning? | Heritage, airport height, tree, coastal or lake buffers | The authority and the relevant departments |
Notice how many of these end in "site visit" or "the authority". No software in this guide removes that. What the tools do well is the first draft: the map, the context, the climate picture and quick "what if" studies. Our longer guide on site analysis in architecture for India walks through each question in depth; the homeowner version is site analysis for homeowners.
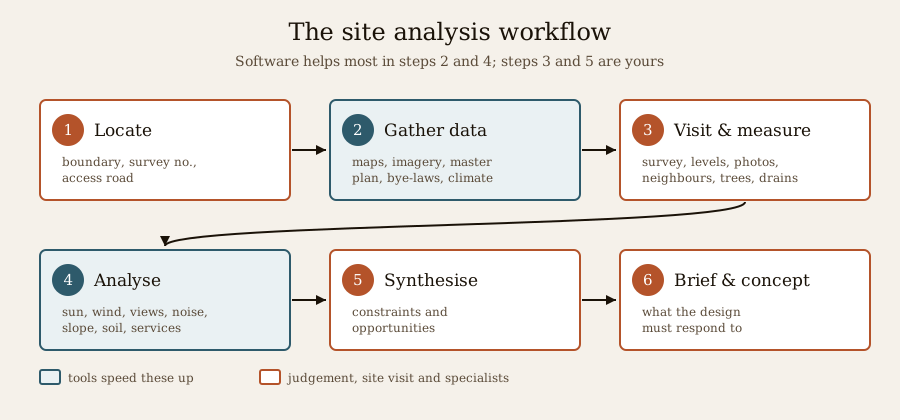
The tools, one by one
ArchiKEK: instant figure-ground and Nolli maps
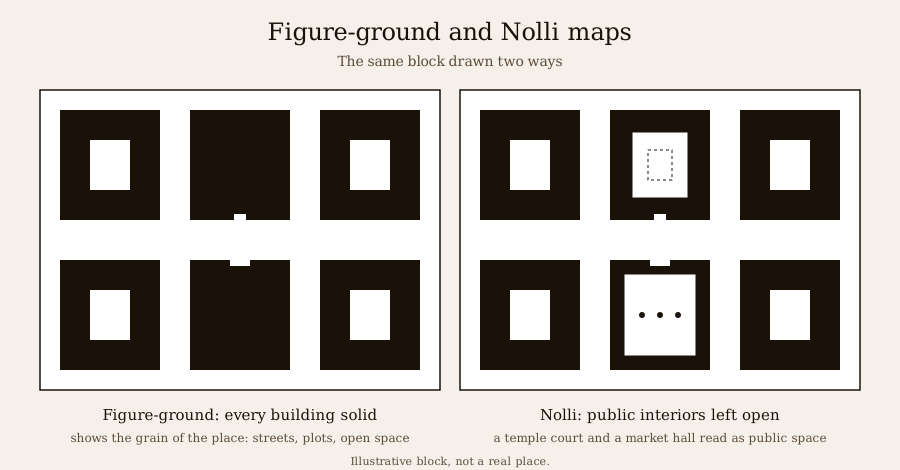
ArchiKEK is a small, recent web tool aimed at architecture students. You pick a location, choose one of 24 drawing themes, and it generates figure-ground maps (buildings as solid black on white), Nolli maps (public interiors drawn open, as in Giambattista Nolli's 1748 plan of Rome) and other urban-analysis drawings. The output can be exported as layered SVG or DXF, so it opens straight into Illustrator, AutoCAD or most CAD tools for further drawing.
Its promise is speed: what used to take an evening of tracing in QGIS or AutoCAD becomes a few clicks. Its data comes from open map sources, so the drawing is only as good as the mapping of that area. In well-mapped city centres the result is excellent; in fast-growing Indian suburbs, new buildings are often missing. Treat it as a base drawing to correct on site, not as a survey. At the time of writing we could not find published pricing or independent reviews, so check the current terms on its own page.
MapServe: an automatic first report (UK)
MapServe is a UK service that produces a site analysis map within minutes for a UK address, showing transport links, schools, health and leisure facilities nearby, alongside the site plans it sells for planning applications. It is useful for UK projects and as a model of what a quick "neighbourhood context" sheet can contain; it does not cover Indian sites.
Autodesk Forma: environmental analysis on massing
Autodesk Forma (now sold as Forma Site Design, with related Forma products for buildings) is a cloud tool for the earliest design stage. You place simple building masses on a real site, then run analyses that update as you move them:
- Sun hours and daylight potential, the latter based on the vertical sky component on facades. Autodesk reported sun-hours analysis as Forma's most-used analysis in 2025.
- Wind, in a rapid AI-assisted version for near-instant feedback and a detailed version, flagging pedestrian discomfort, downdrafts and tunnel effects between buildings.
- Noise from road and rail traffic, with sources drawn by hand or taken from OpenStreetMap.
- Microclimate (outdoor thermal comfort) and, added in July 2026, total carbon (embodied plus operational) at concept stage.
- A link to Revit, so a design can move between concept and detailed model and be re-analysed.
Forma is strongest for multi-building sites, housing layouts and urban blocks, where the interactions between masses matter. For a single house on a 30 x 40 ft plot it is more than most practices need, and its terrain and neighbour data for Indian locations should be checked against the site. Autodesk does not show a single public price on the pages we checked; a 2026 review notes that firms already on Autodesk's AEC Collection get Forma Site Design included. Confirm with Autodesk or a reseller.
Cartes.Archi: parcel research (France)
Cartes.Archi, published by a Lyon company, is a web application that brings together public data for any French parcel: the cadastre, the local planning document, public easements, natural and technological hazards and planning permits. It shows what a well-organised national data system makes possible; India has pieces of this (cadastral maps, master plans), but they are spread across state and city portals and are not joined up in one place.
QGIS: the free, full GIS
QGIS is the free and open-source geographic information system most architects and planners settle on when they need real GIS work: importing survey and cadastral layers, satellite imagery, contours, overlay analysis, and making accurate maps to scale. The 4.x series (QGIS 4.0 arrived in March 2026) moved the program to a new interface toolkit; QGIS 4.2 is the long-term release line. Plug-ins add OpenStreetMap downloads, terrain profiles, sun studies and much more.
It has a learning curve, but it is the one tool here with no licence cost and no limit on what you can do with your own data. Our free course on GIS for architecture, planning and urban design teaches QGIS alongside ArcGIS from first principles.
Google Earth and Google Maps
Still the first stop for most site studies: satellite and aerial imagery, historical imagery to see how an area has changed, 3D views in many Indian cities, and Street View for the approach roads. Imagery dates vary, so check the date shown before drawing conclusions about what stands next door today. Measurements in Google Earth are approximate and never replace a survey.
OpenStreetMap
OpenStreetMap is the free, volunteer-built map of the world. Roads, buildings, water bodies, trees and amenities can be downloaded for any area and brought into QGIS or CAD; many of the tools above draw on it. Coverage in Indian cities is good for roads and improving for buildings, but patchy in new layouts and rural areas. Its licence (the Open Database License) requires credit to "OpenStreetMap contributors" on anything you publish.
A note on ArchiMaps
ArchiMaps, which sometimes turns up in searches for site-analysis tools, is a travel app for finding notable buildings in a city. It is a good guide for an architecture tour, not a site-analysis tool.
The tools at a glance
| Tool | What it does best | Output | Cost (as published) | Works for Indian sites? |
|---|---|---|---|---|
| ArchiKEK | Figure-ground, Nolli and urban drawings in minutes | Layered SVG, DXF | Not published; check the site | Yes, limited by open map coverage |
| MapServe | Automatic neighbourhood report | PDF maps | Per product, UK | No (UK only) |
| Autodesk Forma | Sun, daylight, wind, noise, microclimate, carbon on massing | Interactive model, Revit link | Not published on Autodesk pages checked; included in AEC Collection per a 2026 review | Yes; check terrain and neighbours |
| Cartes.Archi | Parcel rules and hazards in one place | Web map and report | Free during its beta, per one listing | No (France only) |
| QGIS | Full GIS: layers, analysis, mapping to scale | Any GIS or CAD format | Free, open source | Yes, with your own data |
| Google Earth | Imagery, history, 3D context | Images, KML | Free | Yes; check imagery date |
| OpenStreetMap | Open base data for roads, buildings, amenities | Data downloads | Free (credit required) | Yes; coverage varies |
What data exists for an Indian plot
This is where Indian site analysis differs most from the glossy demos. Some data is national and open, some is held by states and cities, and some simply does not exist in public form.
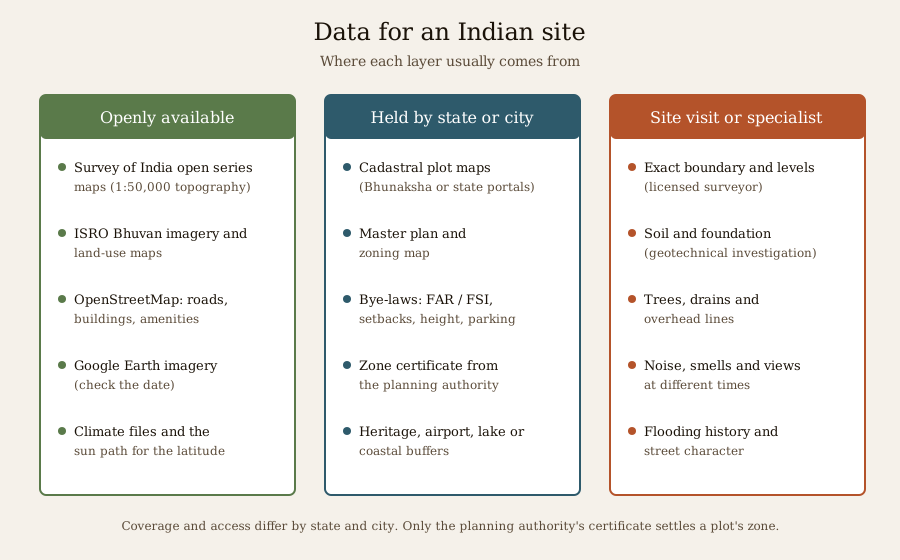
Openly available, national
- Survey of India maps: the Online Maps Portal offers Open Series Maps, including 1:50,000 topographic sheets as vector data, and Survey of India runs geoportal services under free and commercial licences. These give terrain, drainage and settlement patterns at a regional scale, not plot detail.
- Bhuvan, ISRO's geoportal (run by the National Remote Sensing Centre), for satellite imagery and thematic maps such as land use and land cover.
- OpenStreetMap, as above.
- Climate data: typical-year weather files for major Indian cities, used by sun, daylight and energy tools, and the climate tables in Indian standards. Use them for patterns, not for one particular day.
India liberalised its rules on geospatial data in 2021 and published a National Geospatial Policy in 2022, which has opened more mapping to private use. Plot-level information is still mostly held by states.
Held by states and cities
- Cadastral (plot) maps: many states publish village and survey maps through Bhunaksha, a mapping system built by the National Informatics Centre, or their own land-records portals. Access, accuracy and coverage differ from state to state; cities often have separate property maps.
- Master plans and zoning maps: issued by the development or planning authority (for example a city's development authority or the state town planning department). Public versions are often coarse; only the authority's certificate settles a plot's zone, as our guide on zoning and land-use certificates explains.
- Bye-laws: FAR or FSI, setbacks, height and parking for your city, which drive the buildable envelope.
Only from the site or a specialist
- Exact boundary and levels (a licensed surveyor), soil and foundation conditions (a geotechnical investigation), the real neighbours, trees, drains and overhead lines, noise and smells at different times of day, local flooding and waterlogging history, and the character of the street.
How Studio Matrx's free tools fit in
You do not need a paid subscription to start a solid site analysis for an Indian home. These free tools on Studio Matrx cover the numbers; pair them with a site visit and a surveyor.
| Step | Free Studio Matrx tool |
|---|---|
| Judge a plot before buying | Plot Evaluation: 20 weighted checks with risk flags |
| Find the buildable envelope | Plot Buildability, the FAR / FSI calculator and the Setback Visualizer |
| Study the sun and shading | Sun Path Studio and the Sun Path Analyzer for any Indian city and date |
| Understand the ground | Soil bearing capacity (an estimate; a soil test decides) |
| Plan for water | Rainwater harvesting potential |
| Draw it all together | The free Matrx Design Suite: Site & Sun for the plot's location and sun study in 3D, Plot & setbacks for the envelope, and tracing over a scanned plan or a DXF |
The suite keeps the drawing in your browser; nothing is sent anywhere unless you choose to. For the climate side, see understanding sun-path analysis and understanding wind analysis; for slopes, why topography matters; for the numbers before design, plot feasibility analysis.
Choosing the right tool
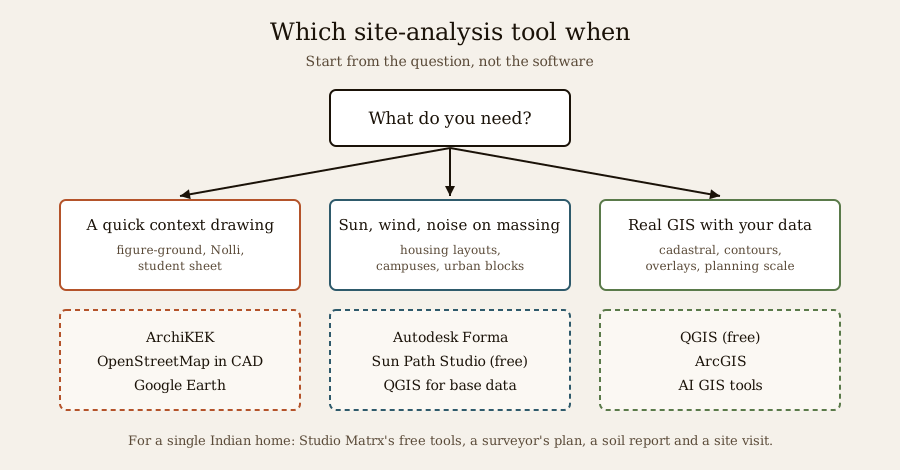
- A student presentation or a quick context sheet: ArchiKEK or OpenStreetMap data in CAD for the figure-ground, Google Earth for imagery, Sun Path Studio for the sun.
- A single house or small building in India: the free Studio Matrx tools above, a surveyor's plan, a soil report and a careful site visit. Add QGIS if you need cadastral or contour layers.
- Housing layouts, campuses and urban blocks: Forma or a similar environmental tool for sun, wind and noise between buildings, with QGIS for the base data.
- Planning-scale work: a full GIS (QGIS or ArcGIS) with state and national layers; see our guide to AI GIS and mapping tools for where the newest AI features help.
Common mistakes
- Treating a generated map as a survey. Open map data misses new buildings and can be metres off. Draw over a licensed survey for anything you build.
- Reading the zone from a screenshot. Only the planning authority's current plan and certificate count.
- Using an imagery date you did not check. A satellite image may be two or three years old in a fast-changing suburb.
- Simulating wind with no local check. Sea breezes, valley winds and neighbouring towers change local wind; talk to people who live there.
- Skipping the soil. No map tells you what is two metres down. Budget for a soil investigation early.
- Forgetting to credit open data. OpenStreetMap and many government datasets require attribution on published drawings.
Key takeaways
- Site-analysis software speeds up the first draft: the context map, the climate picture and quick massing studies. It does not replace the survey, the soil test, the authority's certificate or the site visit.
- ArchiKEK makes figure-ground and Nolli drawings in minutes from open map data; Forma simulates sun, daylight, wind, noise and carbon on massing; QGIS is the free, full GIS; Google Earth and OpenStreetMap remain the everyday base.
- For Indian plots, regional maps and imagery are open (Survey of India, Bhuvan, OpenStreetMap), plot maps and master plans sit with states and cities, and the decisive facts come from the site and specialists.
- Studio Matrx's free tools and the Matrx Design Suite cover the envelope, sun and early numbers for an Indian home without a subscription.
References
1. ArchiKEK — product listing: figure-ground maps, Nolli diagrams and urban analysis drawings, 24 themes, layered SVG or DXF export. Product Hunt, accessed 15 November 2026. producthunt.com
2. MapServe — A guide to the architectural site plan and site analysis map. Accessed 15 November 2026. mapserve.co.uk
3. Autodesk — Start your pre-design site analysis with Forma Site Design's sun hours analysis, and Looking ahead to 2026 (Forma blog). Accessed 15 November 2026. blogs.autodesk.com and blogs.autodesk.com
4. Autodesk — Introducing total carbon analysis in Forma Site Design, 17 July 2026. blogs.autodesk.com
5. Illustrarch — Autodesk Forma review (2026), including AEC Collection inclusion. illustrarch.com
6. data.gouv.fr — Cartes.Archi organisation page (parcel data for architects), and AEC+Tech — Cartes.Archi listing (free during public beta). Accessed 15 November 2026. data.gouv.fr and aecplustech.com
7. QGIS — Update on QGIS 4.0 release schedule and LTR plans, 7 October 2025, and the QGIS roadmap. blog.qgis.org and qgis.org
8. Survey of India — Online Maps Portal (Open Series Maps). onlinemaps.surveyofindia.gov.in
9. Takshashila Institution — State of India's Geospatial Portals, 24 October 2025. takshashila.org.in
10. OpenStreetMap Wiki — India / Government of India (data sources and licences). wiki.openstreetmap.org
11. Cityweft — The complete guide to site analysis for architects: data sources, mapping tools and workflows. cityweft.com
12. ArchiMaps — App Store listing (architecture travel guide). apps.apple.com
Last verified 15 November 2026. Software features, names and prices change frequently; confirm with each vendor before you buy. Data availability differs by state and city. A site analysis informs design; boundaries, soil, structure and approvals need a licensed surveyor, a geotechnical engineer, a structural engineer and the local authority.
Export this guide
Related Guides — Deep-dive reading
Site Analysis for Homeowners: How to Read a Plot Before You Build
The master guide to reading your land — its legal envelope, sun, wind, slope, soil, access, neighbours, views, services and microclimate — before you buy a plot or draw a plan.
Site PlanningUnderstanding Site Planning for Residential Projects
A homeowner's landscape guide to reading your plot's sun, wind, water, soil and trees before zoning and building the grounds.
LandscapeHow to Choose a Security System (2026): The Master Buying Guide for Indian Homes and Buildings
The mental model that ties the whole buying decision together: start from your own risk, not a product; build the layers your situation actually needs; make the big architecture choices (wired vs wireless, local vs cloud, DIY vs professional); tell real product quality from marketing; and choose a vendor you can trust.
SecurityRelated Tools — Try Free
Cross-Ventilation Analyzer
Estimate airflow and air changes per hour (ACH) from room size, window areas, layout, and local wind — with a minimum window-area check (NBC-based; check SP 7:2026 and local bylaws).
Ventilation CalculatorBrise-Soleil Visualizer
Interactive horizontal-louvre cut-off angle calculator — sun altitude, louvre depth, and spacing inputs with a live shadow preview. Computes θ = arctan(spacing/depth) for façade shading, ECBC envelope compliance, hospital daylight design, and tropical sun-control detailing.
Sun Shading ToolAcoustic Privacy (STC) Visualizer
Indian healthcare acoustic visualizer — compare wall assemblies and noise sources, see received SPL after STC attenuation, and check FGI 2018 / IS 1950 / NABH speech-privacy compliance with live dual-canvas waveform.
Acoustic Tool