
Site Analysis for Architecture in India — A Student's Working Reference
Seven Dimensions · Five-Phase Process · Indian-Context Specifics · 30-Page Deliverable
Site analysis is the discipline that grounds every design move in evidence. Done well, each architectural decision can be traced back to a specific site finding. Done badly, the design rests on assumptions that fail in actual conditions.
This guide is the working reference for Indian B.Arch and M.Arch students on site analysis as a discipline. It covers the seven dimensions to investigate, the five-phase process over 8-12 weeks, six Indian-context specifics that differ from global templates, ten common mistakes, and the toolchain.
Site analysis is not a checklist item. It is the design driver. Every design move you make should trace back to a specific site finding. If it can't, the analysis was decoration not investigation.
For complementary depth see Architecture Thesis Methodology, Architecture Thesis Topics, Architecture Case Study Analysis, Architectural Drawing Representation Fundamentals.
This is an evergreen guide — methodology has been stable since the 1960s. Last verified: May 2026 · Next verify: May 2028.
The Seven Dimensions

Site analysis investigates seven distinct dimensions. Each one contributes specific findings that translate into design implications.

1. Physical + Topographic
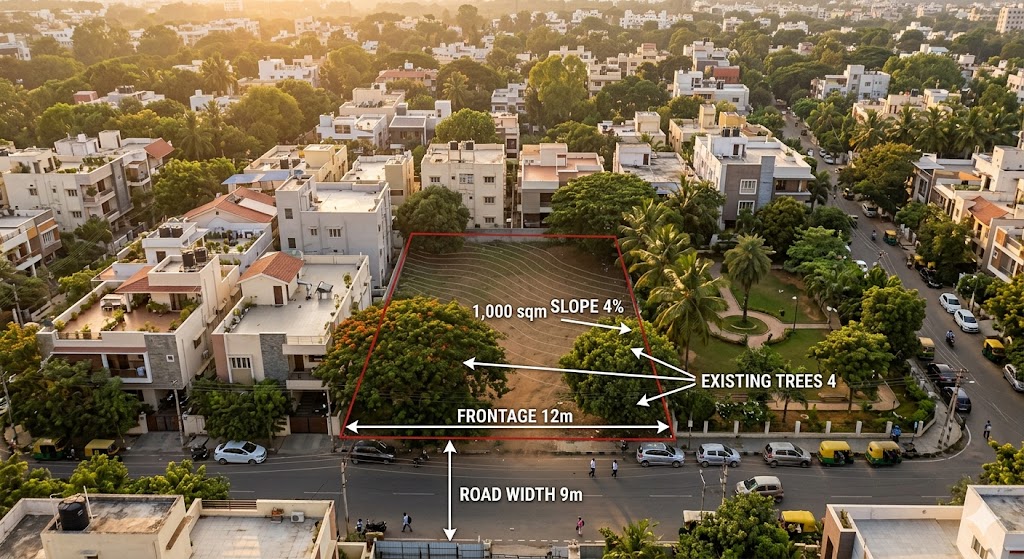
Site dimensions, area, FAR potential, contours + slope, soil bearing capacity (SBC report mandatory), geology, water table, hydrology, existing vegetation.
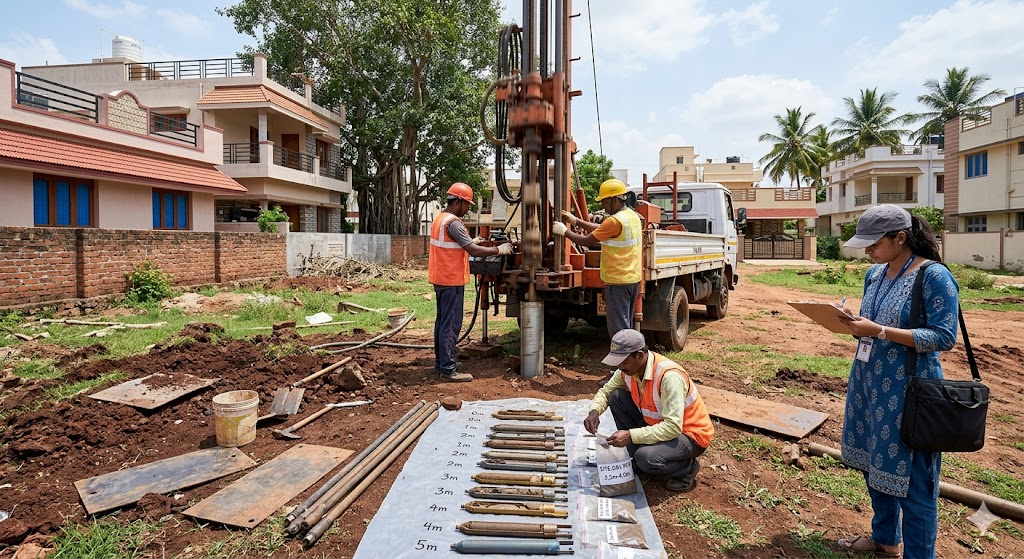
Methods: total station / DGPS / theodolite survey, soil test (3 boreholes typical), drone survey for larger sites.
Deliverables: contour plan at 0.5m, slope analysis, signed soil report, drainage analysis, existing condition photos.
2. Climate + Microclimate
Climate zone (NBC 2016 / SP 41 — 6 Indian zones), sun path, wind rose, temperature + humidity averages, annual rainfall + monsoon timing, microclimate variations.
Methods: IMD station data (10+ years), Climate Consultant + Ladybug, on-site sun diary, NBC 2016 Part 8 climate analysis.
Deliverables: climate analysis summary, sun path diagrams (4 seasons), wind rose, comfort hours analysis.
3. Regulatory + Legal
Land use zoning, FAR + ground coverage + height + setbacks, heritage listing (ASI / state / INTACH), easements, ULB-specific bylaws.
Methods: ULB bylaws document review, approved zoning map, title deeds, legal review.
Deliverables: regulatory summary table, bylaw quotes + interpretations, heritage status note.
4. Cultural + Social
Neighbourhood character, community demographics, vernacular references, stakeholder mapping, existing rituals + daily life patterns.
Methods: walking survey + photo essay, Census 2011 + state updates, stakeholder interviews (5-10), ethnographic observation.
Deliverables: neighbourhood character study, demographic + cultural map, vernacular reference set, stakeholder matrix.
5. Functional + Access
Road access + frontage, public transit + frequency, pedestrian routes, service + emergency vehicle access.
Methods: traffic + footfall count (3 time slots), local transit check, service vehicle turning radius, fire department ingress.
Deliverables: access + circulation diagram, traffic count summary, pedestrian flow plan.
6. Ecological + Environmental
Existing vegetation + tree census, fauna + protected status, water bodies + watersheds, flood + seismic risk, pollution sources.
Methods: tree survey + species identification, fauna observation, CGWB watershed + flood data, IS 1893 seismic zone reference.
Deliverables: tree census plan, habitat connectivity map, watershed + drainage plan, hazard zone identification.
7. Visual + Aesthetic
Views into the site (entry sequence), views out (selling views), skyline + landmarks + scale references, sound + smell + light at site boundary, heritage building proximity.
Methods: sectional view diagrams, panoramic photo set, skyline study, acoustic + olfactory walk, sight-line analysis.
Deliverables: visual analysis diagram, panoramic photo set, sensory walk notes, sight-line study.
Cumulative deliverable
25-40 page bound site analysis document + 10-15 site analysis drawings + 3-5 photo essays + 5-10 stakeholder interview summaries + 2-page executive summary.
The Five-Phase Process

Phase 1 — Desktop research (Wk 1-2, 10-15 hrs): Google Earth + Sat imagery + topo maps, ULB bylaws + zoning + master plan, Census 2011 + state demographics, IMD climate data, IS code references.
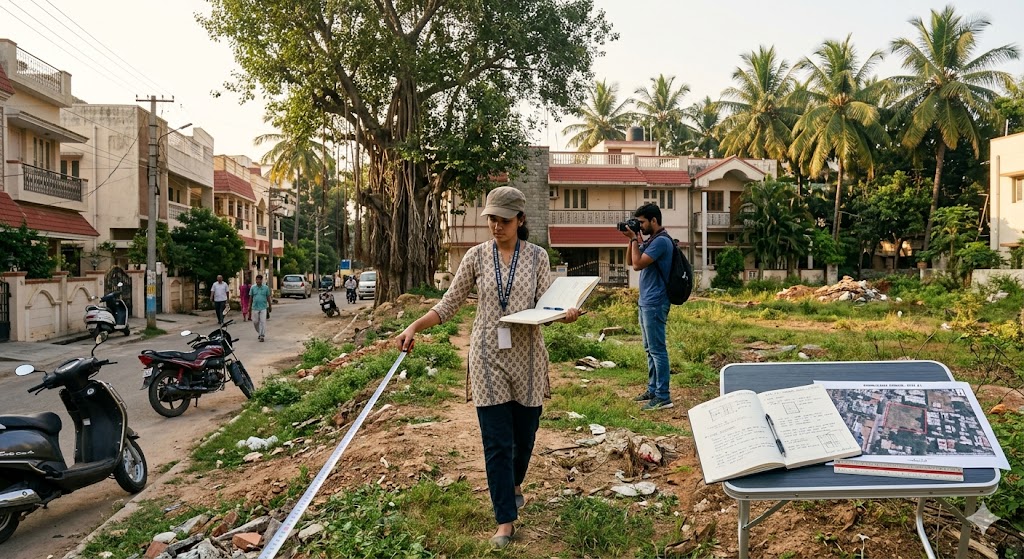
Phase 2 — Site visits + observation (Wk 2-4, 25-40 hrs): 5-7 visits at different times of day, photography + sketching + dimension check, sun-path + wind verification on site, stakeholder interviews (5-10), acoustic + olfactory walk.
Phase 3 — Specialist studies (Wk 4-6, 15-25 hrs): Soil bearing capacity test (3 boreholes), tree census + species identification, traffic count (peak + off-peak), structural condition for existing.
Phase 4 — Analysis + synthesis (Wk 6-8, 20-30 hrs): SWOT (Strengths/Weaknesses/Opportunities/Threats), opportunities + constraints matrix, design implication translation, key insights for thesis brief.
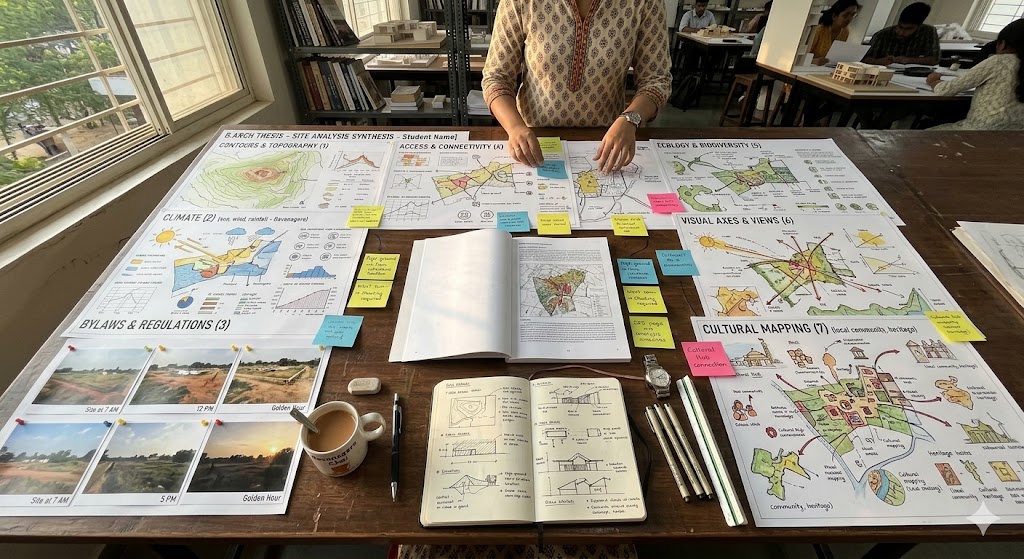
Phase 5 — Documentation (Wk 8-10, 15-25 hrs): site analysis drawing set (10-15 drawings), bound document (25-40 pages), executive summary (2 pages), presentation deck.
Total: 85-145 hours across 8-12 weeks. Cannot be compressed below 6 weeks for genuine quality. Plan thesis Gantt accordingly.
For a studio project (8-12 weeks total), scale down to ~30-50 hours of site analysis; skip soil report + specialist studies; focus on Phases 1, 2, 4.
Six Indian-Context Specifics

Indian site analysis demands more rigour than global templates suggest. Six specifics that differ.
1. Climate diversity across 6 zones — Hot-Dry, Warm-Humid, Composite, Cold, Tropical Savanna, Tropical Wet. Same building solution does NOT work across zones. Hot-Dry needs courtyards; Cold (Himalayan) needs solar heat gain.
2. Complex regulatory landscape (ULB to ULB) — Each ULB has different bylaws. FAR for same plot in Bangalore vs Mumbai vs Delhi often differs by 30-50%. Setbacks differ. Approval process differs.
3. Heritage + ASI overlay considerations — ASI protects sites + 100m + 200m around them. State archaeology dept protects state-listed sites. INTACH lists unprotected heritage. Check all three. NMA approval timelines: 6-18 months for ASI overlay.
4. Seismic + cyclone hazard mapping — Most Indian sites have non-trivial seismic or cyclone hazard. IS 1893 has 5 zones. Coastal cyclone zones have additional wind requirements.
5. Cultural + religious site sensitivities — Nearby temples, mosques, churches, gurudwaras with festival activity, processions, daily worship. Sound restrictions, visual sight-lines to deity may apply.
6. Informal settlement + stakeholder mapping — Many Indian sites have informal settlements nearby or on-site. Tenure may be contested. Livelihoods embedded. Generic site analysis misses these.
Ten Common Site Analysis Mistakes

1. Treating site analysis as checklist not design driver
2. Visiting the site only once
3. Not visiting at multiple times of day
4. Skipping the soil bearing capacity test
5. Using satellite imagery as substitute for site visit
6. Text-heavy documentation without drawings
7. Ignoring regulatory + bylaws framework
8. Not mapping stakeholders
9. Skipping zone-specific climate analysis
10. Not translating findings to design implications
The honesty test
Show your site analysis to a senior alumnus. Ask: "Can you trace any 3 design moves I've made back to specific site findings?" If no, the analysis is decoration.
The Toolchain

Software (mostly free)
QGIS (free GIS), Google Earth Pro (free), Ladybug Tools (free climate analysis in Rhino/GH), Climate Consultant (free UCLA tool), AutoCAD or QGIS for drawings, Photoshop or Affinity for diagrams.
Field tools (₹ 3,000-7,000 total)
Measuring tape (30m + 5m), laser distance meter (Bosch GLM 50 is reliable), compass + clinometer (or phone apps), sun path tool (Sun Surveyor app), DSLR/phone camera, sketchbook + 2B pencil.
Indian data sources (free)
Bhuvan (ISRO) — best Indian-context portal for satellite imagery + thematic maps. IMD — 30+ year climate normals at station level. Census 2011 + state stats — ward-level demographic granularity. CGWB — watershed data. NDMA — hazard zone maps.
Pre-Site-Analysis Checklist
1. Site shortlist confirmed with thesis guide
2. Initial site visit done (orientation, not full analysis)
3. Site title clarity verified (legal status, ownership)
4. Soil testing agency identified, quote received
5. ULB bylaws document acquired
6. Camera + measuring tape + sketchbook ready
7. Stakeholder list drafted (5-10 names to interview)
8. Site analysis Gantt drafted (8-12 weeks)
9. Site visit schedule planned (5-7 visits across morning + noon + evening + weekend + monsoon if possible)
10. Software stack installed and tested (QGIS, Google Earth Pro, Climate Consultant)
Where to Go Next
- For thesis methodology: Architecture Thesis Methodology in India
- For thesis topic selection: Architecture Thesis Topics in India
- For case study discipline (precedent analysis): Architecture Case Study Analysis
- For climate-zone depth: Cross-Ventilation in Indian Homes, Natural Light Planning, Designing for Indian Climate
- For regulatory context: Building Plan Approval Process in India, Building Bylaw Atlas, state-specific atlas pages
- For drawing standards: Architectural Drawing Representation Fundamentals
References
1. NBC 2016, Part 0 + Part 2. Definitions and Administration; General Building Requirements.
2. NBC 2016, Part 8 (Building Services), Section 4 (Acoustic). Climate Zone Classification.
3. SP 41 (BIS 1987). Handbook on Functional Requirements of Buildings.
4. IS 1893 (BIS 2016). Criteria for Earthquake Resistant Design of Structures (Seismic Zone Map).
5. IS 875 Part 3. Code of Practice for Design Loads (Wind).
6. Lynch, K. (1960). The Image of the City. MIT Press.
7. White, E.T. (1983). Site Analysis — Diagramming Information for Architectural Design. Architectural Media.
8. Bhuvan (ISRO) Indian satellite imagery portal — bhuvan.nrsc.gov.in
9. IMD India Meteorological Department. Climate normals + station data.
10. Census of India 2011. Demographic data at ward + district level.
Author's note: Site analysis is the most undervalued discipline in Indian architectural education. Students skip it, faculty don't reinforce it, theses are weaker for it. The discipline pays back over a 40-year career — every project gets stronger when site analysis is rigorous. Treat it as the design DRIVER not the design PREAMBLE. Each finding should translate to an implication. Each implication should shape a design move. That traceability — finding to implication to design — is what makes thesis defensible at viva and built work defensible in practice.
Disclaimer: Site analysis methodology is stable; this guide refreshes every 24 months. Specific Indian regulatory references (ULB bylaws, ASI heritage rules, IS codes) evolve more frequently — verify currency before locking your site analysis. Soil bearing capacity testing must be done by certified geotechnical engineers; do not rely on visual assessment. Heritage status verification with ASI, state archaeology, and INTACH should be done independently before commitment. Studio Matrx, its authors and contributors are not responsible for design or regulatory decisions based on this guide.
Interactive · Site analysis overlay
Entrance facing NE · Best
Which direction does your plot's entrance face?
Best · entrance NE
Ishanya — auspicious in Vastu, gentle morning sun, no harsh afternoon heat on the entry facade.
Pros
- • Morning sun on entry & living spaces
- • West/south can be load-bearing & shaded
- • Vastu-aligned
Cons
- • Cooler in winter on the entry side
Design mitigations
- • Glaze NE generously (≤ 30% WWR)
- • Solid masonry / cavity wall on SW
Sun arcs shown for a typical north-Indian latitude (~28°N). Actual altitudes vary 5-15° between Kanyakumari and Srinagar.
Export this guide
Related Guides — Deep-dive reading
Site Analysis for Homeowners: How to Read a Plot Before You Build
The master guide to reading your land — its legal envelope, sun, wind, slope, soil, access, neighbours, views, services and microclimate — before you buy a plot or draw a plan.
Site PlanningUnderstanding Site Planning for Residential Projects
A homeowner's landscape guide to reading your plot's sun, wind, water, soil and trees before zoning and building the grounds.
LandscapeCase-Study Analysis — How to Read an Architectural Project
Module 7 of the Student Foundations Track — Selecting Case Studies that Match Your Design Problem, Five-Layer Analysis Framework (Site, Programme, Form, Material, Detail), Data Collection Methods, How to Apply Findings to Your Own Studio Project, the Citation Discipline, and a Twelve-Test Pre-Submission Diagnostic for Indian B.Arch Students
Student FoundationsRelated Tools — Try Free
Cross-Ventilation Analyzer
Estimate airflow and air changes per hour (ACH) from room size, window areas, layout, and local wind — with NBC 2016 Part 8 compliance check.
Ventilation CalculatorStructural Modification Approval Checklist
41 items across structural assessment, society approval, municipal compliance, and safety.
Approval ChecklistBuilding Bylaw Checker
Check FAR, setbacks, and height limits for 12 Indian cities (BBMP, CMDA, BMC, DDA, and more).
ArchitectAI