
How Much Light Does the Table Actually Need?
PAGE 1
Before Counting Lumens, Define What We Are Measuring
Ask how much light a dining table needs and the first answer is often given in lumens: 400 lumens, 600 lumens, perhaps 800. That sounds precise, but it begins with the wrong quantity. The lumen rating printed on a luminaire tells us how much luminous flux the source or luminaire emits. It does not tell us how much of that light will arrive on the tabletop, how evenly it will arrive, how bright the table will appear, or whether the people seated around it will find the source visually comfortable.
For a surface such as a dining table, the useful starting quantity is illuminance, expressed in lux. The CIE defines illuminance as the density of incident luminous flux with respect to area, and the SI relationship is straightforward: 1 lux equals 1 lumen per square metre. NIST gives the same unit relationship in its SI references.
That distinction is fundamental. Imagine two luminaires that are both rated at 600 lumens. One directs most of its output downward in a controlled distribution. The other spreads light broadly onto the ceiling, walls and room around the table. Their total lumen ratings may be identical while the illuminance measured on the tabletop is completely different. The luminaire output is therefore only the beginning of the calculation.
This article deliberately reduces the problem to one bounded task. We will use a 1.80 m × 0.90 m rectangular dining table, with one centred luminaire above it. We will adopt 100 lux as a StudioMatrx test target solely to make the mathematics visible. That number is not being presented as a mandatory residential standard, an Indian code requirement or a universal recommendation for dining.
That distinction matters enough to establish before any arithmetic begins.
Technical reference: CIE — Illuminance CIE International Lighting Vocabulary: Illuminance
Technical reference: NIST — Lux NIST: Lux definition
PAGE 2
Reference Value And Test Value Are Not The Same Thing
Lighting recommendations have to be read within their context. A number developed for a workplace task, restaurant, hotel, residence or circulation space cannot automatically be transferred to another setting simply because all of them are measured in lux. Age, activity, visual task, atmosphere and the surrounding visual field can all affect the design criterion.
India now has a revised National Lighting Code of India, SP 72:2025, published by the Bureau of Indian Standards as the first revision of the 2010 code. BIS states that the revised code covers modern lighting applications including residential and hospitality lighting, photometry, controls and related subjects. Because the freely accessible BIS material does not give us a dining-table numerical value from the complete final code that we can verify directly, StudioMatrx should not invent one or attribute one to SP 72:2025.
The current American residential recommended practice is ANSI/IES/ALA RP-11-26, published by the Illuminating Engineering Society in 2026. The official IES page confirms that the standard contains criteria for quantity and quality of illumination and that its Annex A contains illuminance recommendations. The detailed numerical table, however, is part of the full standard rather than the public product page. For exactly the same reason, this article will not quote an RP-11-26 dining value that we cannot verify from the document itself.
There is useful historical context. An official IES article on restaurant lighting published before RP-11-26 reports an IES reference of 3 to 6 footcandles at dining tables, varying with age. Using the CIE conversion of 1 footcandle = 10.764 lux, that corresponds to approximately 32 to 65 lux. This is useful evidence that dining illumination has been discussed at relatively modest levels, but it is not being treated here as the current universal residential recommendation.
That leaves us with a deliberately transparent method. We have reviewed current authoritative standards, identified what can and cannot be verified publicly, and selected 100 lux as our own test target. From this point onward, every numerical result belongs to the StudioMatrx worked example unless specifically identified as an external definition or reference.
| Variable | Status | Value used |
|---|---|---|
| Table length | StudioMatrx assumption | 1.80 m |
| Table width | StudioMatrx assumption | 0.90 m |
| Test average illuminance | StudioMatrx assumption | 100 lx |
| Luminaire position | StudioMatrx assumption | Centred |
| Vertical source-to-table distance | StudioMatrx assumption | 0.90 m |
| SP 72:2025 | Current BIS code | No dining-table number inferred here |
| ANSI/IES/ALA RP-11-26 | Current IES residential practice | Numerical Annex A value not reproduced without the standard |
Current Indian reference: BIS — SP 72:2025 National Lighting Code of India
Current residential reference: IES — ANSI/IES/ALA RP-11-26
Contextual restaurant reference: IES — The Secret Recipe for Restaurant Lighting
PAGE 3
Calculation One: How Much Flux Must Actually Arrive On The Table?
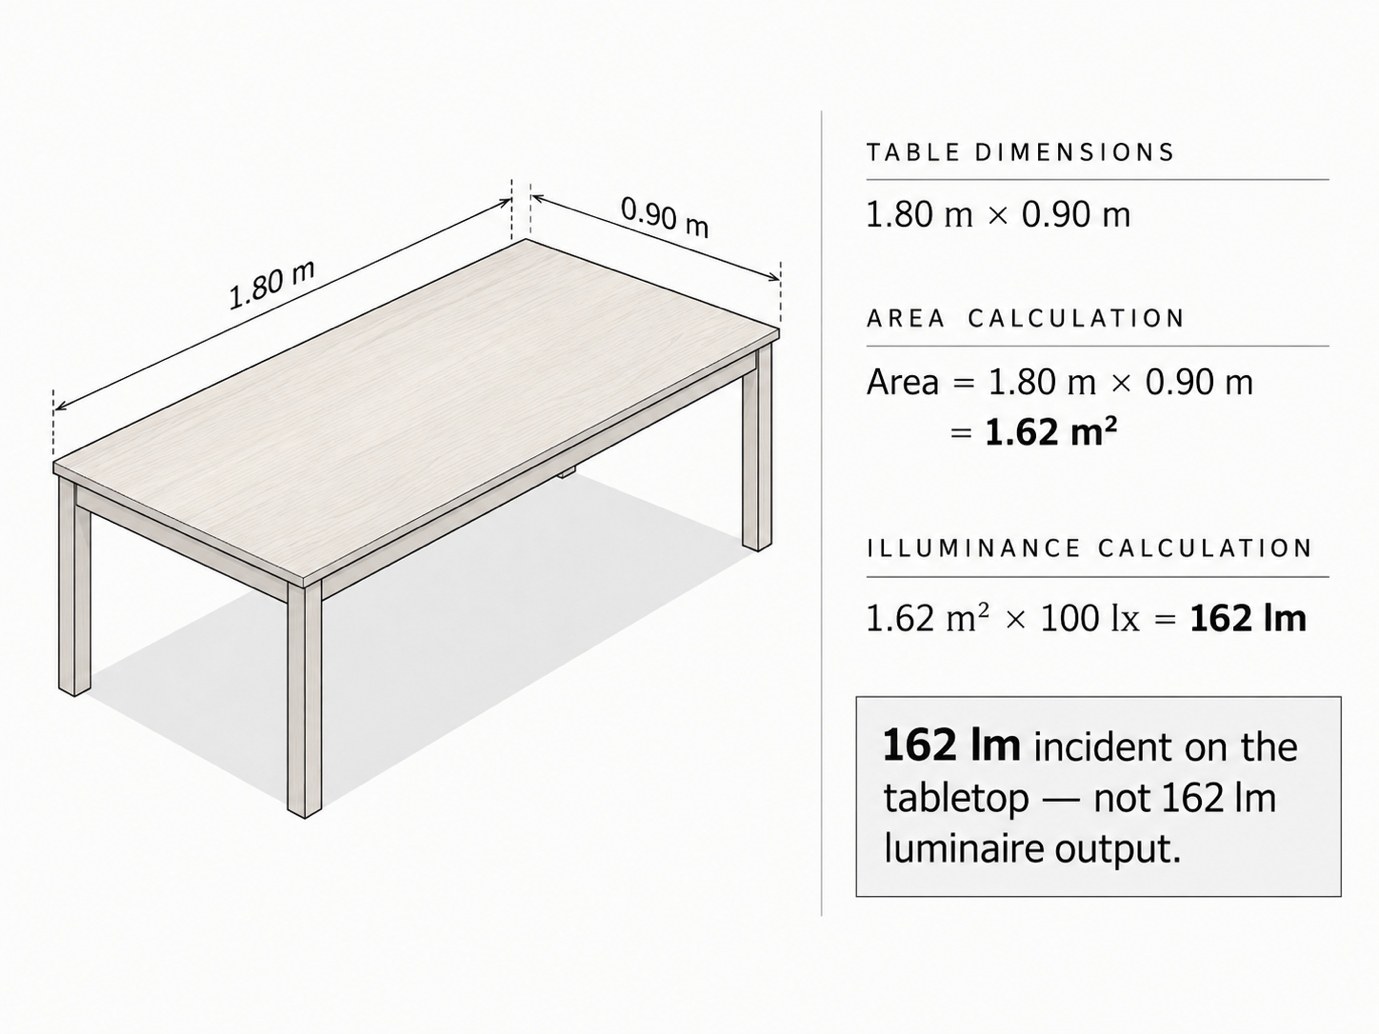
The first calculation is straightforward because illuminance is luminous flux distributed over area. Our rectangular dining table measures 1.80 m by 0.90 m, so its surface area is:
A = L × W
A = 1.80 × 0.90
A = 1.62 m²
The test target is an average illuminance of 100 lux across that area. Because one lux equals one lumen per square metre, the corresponding luminous flux incident on the table is:
Φtable = Eavg × A
Φtable = 100 lx × 1.62 m²
Φtable = 162 lm
This is the first important result of the article, but it is also the number most likely to be misunderstood. 162 lumens is not the required lumen rating of the pendant. It represents the idealised luminous flux that would have to arrive on the defined tabletop area to produce an average of 100 lux if that flux were distributed as assumed.
Changing the test illuminance changes that figure proportionally:
| StudioMatrx test illuminance | Table area | Incident flux corresponding to average |
|---|---|---|
| 50 lx | 1.62 m² | 81 lm |
| 100 lx | 1.62 m² | 162 lm |
| 150 lx | 1.62 m² | 243 lm |
| 200 lx | 1.62 m² | 324 lm |
The calculation is simple because it is intentionally only the first layer. It tells us how much luminous flux corresponds to a target average over a known area. It tells us almost nothing yet about the luminaire necessary to create that result.
PAGE 4
Calculation Two: The Luminaire Has To Produce More Than The Table Receives
A real luminaire does not deliver every emitted lumen to the dining surface. Depending on its optical distribution, shade, diffuser, mounting position and the surrounding geometry, some output can travel outside the table, toward surrounding surfaces or in other directions. Therefore the rated luminaire flux necessary to achieve our target cannot be obtained merely by reading 162 lumens from the previous calculation.
To demonstrate the sensitivity without pretending that we know the performance of a particular product, we can introduce a deliberately hypothetical quantity: the proportion of emitted luminous flux that actually lands on the defined tabletop. This is not a formal coefficient of utilisation calculation and it should not be used to specify a real luminaire. It is simply a numerical test showing why source lumens and tabletop lumens cannot be treated as the same quantity.
If 25 per cent of the luminaire output reached the table:
Φluminaire ≈ 162 ÷ 0.25
Φluminaire ≈ 648 lm
If 40 per cent reached the table:
Φluminaire ≈ 162 ÷ 0.40
Φluminaire ≈ 405 lm
If 60 per cent reached the table:
Φluminaire ≈ 162 ÷ 0.60
Φluminaire ≈ 270 lm
The same tabletop target can therefore correspond, in this simplified exercise, to source outputs ranging from approximately 270 to 648 lumens solely because the assumed optical delivery changes.
| Illustrative delivery to table | Incident flux required | Illustrative luminaire output |
|---|---|---|
| 25% | 162 lm | 648 lm |
| 40% | 162 lm | 405 lm |
| 60% | 162 lm | 270 lm |
For a real project, this assumed percentage would be replaced by actual photometric data. The luminaire’s luminous intensity distribution, mounting position, room geometry and reflections would determine where its output goes. The point of this page is not to recommend a 405-lumen pendant. It is to demonstrate why the phrase “I need 162 lumens” cannot be taken from the area calculation and turned directly into a product specification.
PAGE 5
Calculation Three: What Does The Beam Actually Cover?
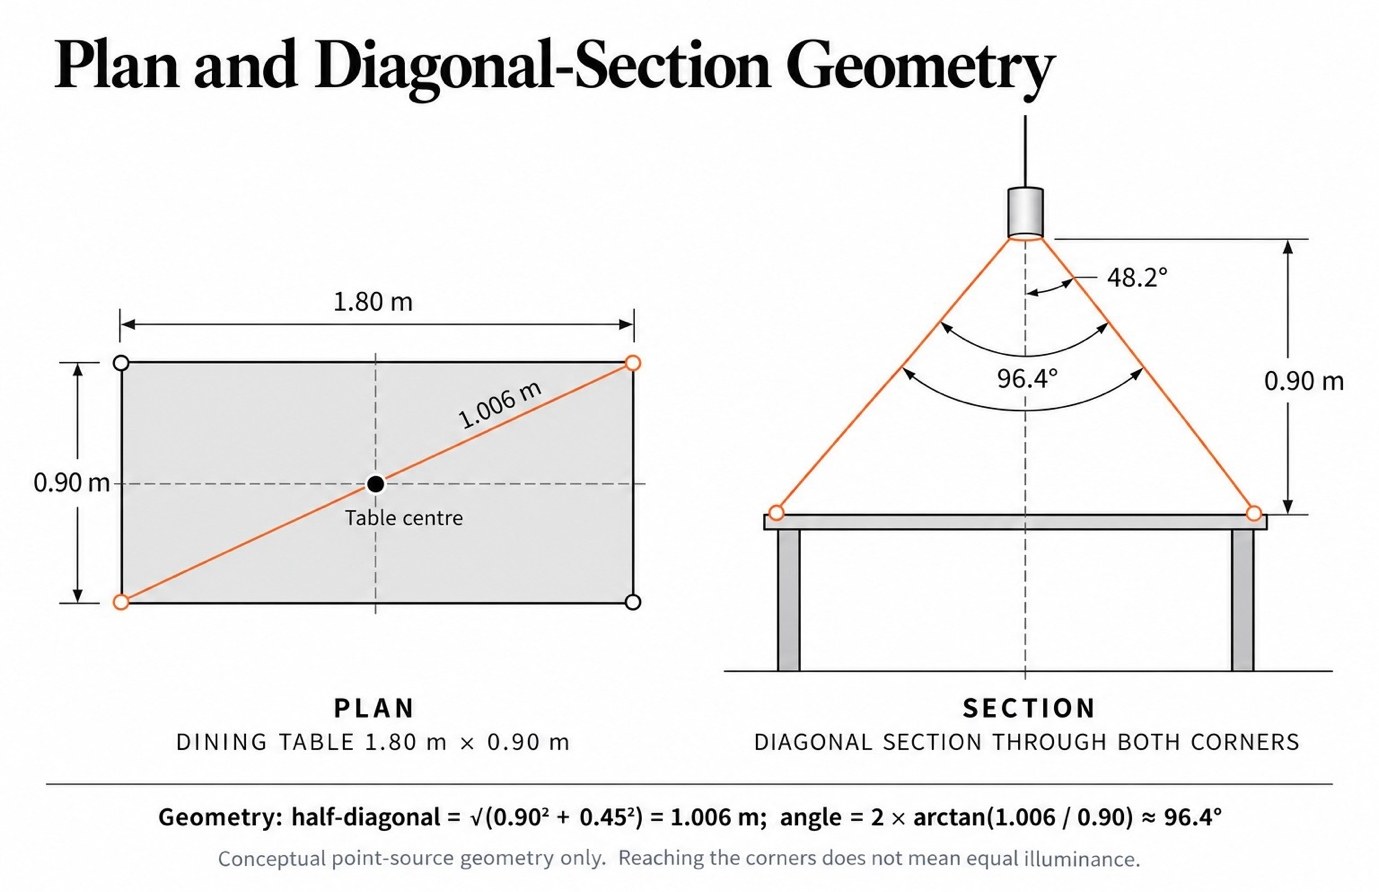
We will now add geometry. Our test luminaire is centred over the 1.80 m × 0.90 m table, and the vertical distance from the light source to the tabletop is assumed to be 0.90 m. For a simplified rotationally symmetrical cone, a nominal beam diameter can be estimated from:
D = 2H × tan(θ ÷ 2)
where D is the nominal diameter on the table, H is the vertical source-to-table distance and θ is the full beam angle.
At 0.90 m:
| Nominal beam angle | Nominal diameter at tabletop |
|---|---|
| 60° | 1.04 m |
| 80° | 1.51 m |
| 90° | 1.80 m |
| 100° | 2.15 m |
| 120° | 3.12 m |
It would be tempting to look at the 90-degree row and conclude that a 90-degree beam is perfect because the calculated diameter equals the table’s 1.80 m length. The plan tells us why that conclusion is wrong. The table has width as well as length, so its corners are farther from the centre than the midpoint of either edge.
From the centre of the tabletop to one corner:
r = √(0.90² + 0.45²)
r = √(0.81 + 0.2025)
r = √1.0125
r ≈ 1.006 m
Using the assumed vertical distance of 0.90 m:
α = tan⁻¹(1.006 ÷ 0.90)
α ≈ 48.2°
The corresponding full symmetrical cone angle is:
2α ≈ 96.4°
Pure geometry therefore tells us that approximately a 96.4-degree cone would be required for the nominal cone to reach the four tabletop corners from this position.
But this does not mean that a 96.4-degree beam would illuminate the table uniformly.
PAGE 6
Beam Angle Does Not Describe A Uniformly Bright Circle
The previous geometry becomes more useful once the technical definition of beam angle is introduced. The Illuminating Engineering Society defines beam angle as the angle between the two directions at which luminous intensity has fallen to 50 per cent of the maximum intensity. The nominal beam edge is therefore not the edge of the light and it is certainly not the boundary of a uniformly illuminated circle.
That means a “100-degree beam” should not be interpreted as 100 degrees of equal output followed by darkness. For a rotationally symmetrical fitting, the 50-degree direction on either side of the centreline marks approximately the point at which intensity reaches half the maximum. Light can continue beyond that region; the IES separately defines the field angle at the 10-per-cent intensity directions.
Our table corner lies approximately 48.2 degrees from the vertical axis. Geometry alone also reduces horizontal illuminance at an off-axis point. For an idealised point source over a horizontal plane, the IES cosine-cubed relationship is:
Eh = I(γ) × cos³(γ) ÷ H²
Where:
Eh = horizontal illuminance
I(γ) = luminous intensity in the direction being tested
γ = angle away from vertical
H = vertical source-to-table distance
At our calculated corner angle:
γ ≈ 48.2°
cos³(48.2°) ≈ 0.296
This means that if the luminous intensity in the corner direction happened to be equal to the downward intensity, the geometry alone would reduce horizontal illuminance there to roughly 30 per cent of the centre condition. Real luminaires do not normally maintain identical luminous intensity at every angle, so the actual result must be obtained from the luminaire’s photometric distribution.
This distinction is crucial. A beam can geometrically extend across the entire table while still leaving the perimeter substantially less illuminated than the centre. The manufacturer’s polar intensity curve or photometric file therefore tells us much more than the nominal beam-angle label by itself.
Technical reference: IES — Beam angle definition
Technical reference: IES — Field angle definition
Technical reference: IES — Cosine-cubed law
PAGE 7
Mounting Height Changes Both Spread And Intensity
If the pool of light feels too concentrated, one obvious response is to move the source higher. Geometrically, this increases the beam footprint. Photometrically, however, increasing the distance also reduces illuminance.
For an ideal point source with the receiving surface normal to the incident light, the inverse-square law gives:
E ∝ 1 / d²
The IES specifies that this relationship applies strictly to point-source behaviour and also notes limitations when the physical source is large relative to the measuring distance. This is why the calculation below should be treated as an idealised point-source comparison, not as an exact prediction for every decorative pendant.
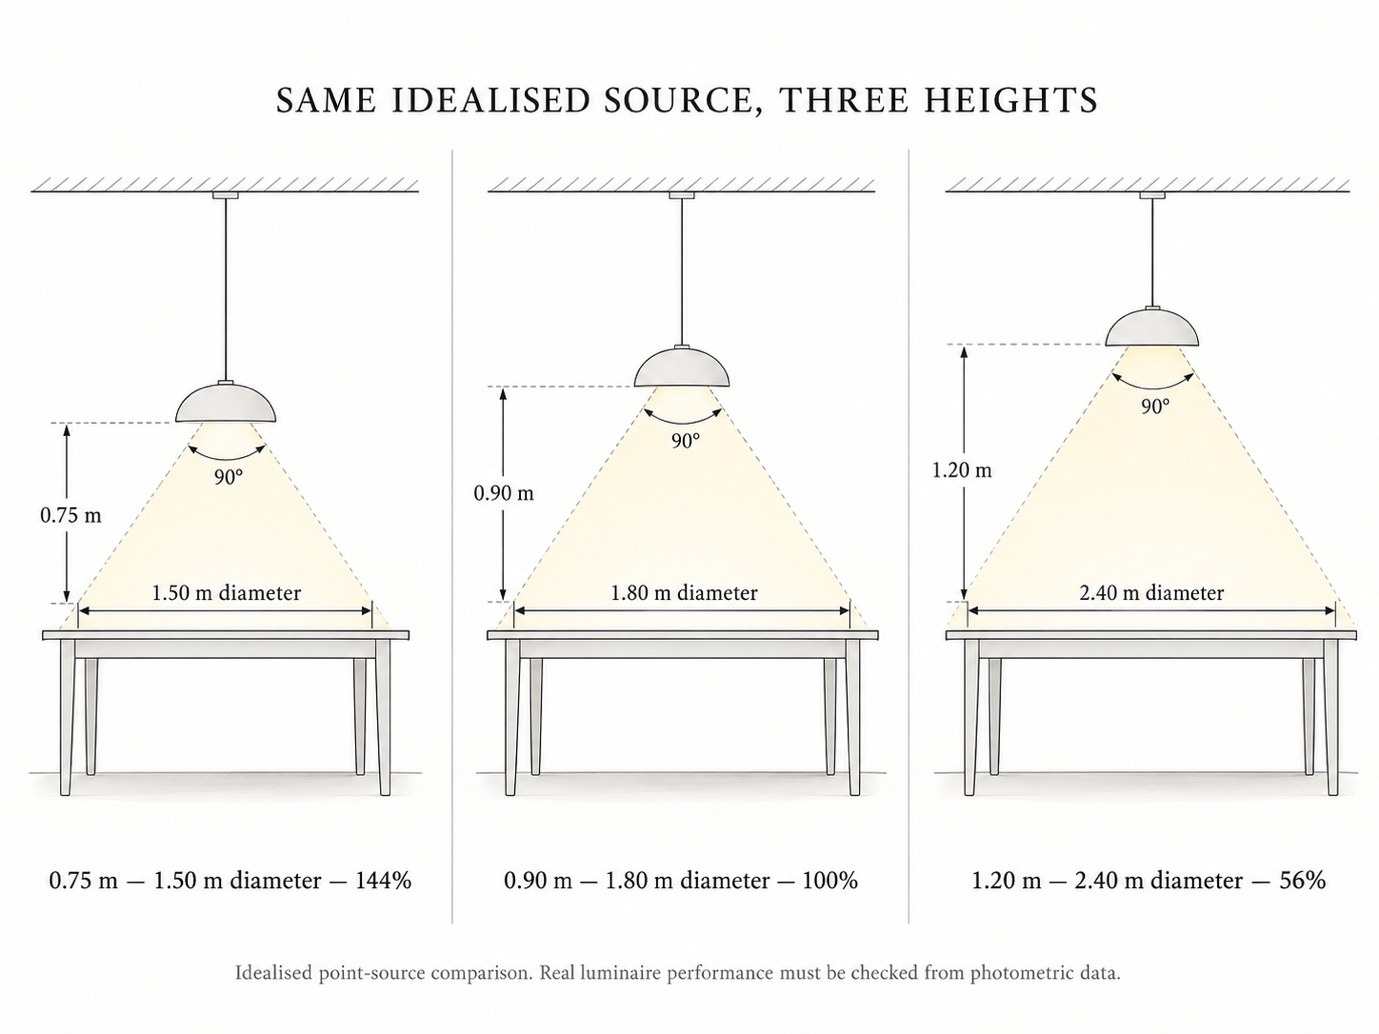
Using 0.90 m as our reference height, and keeping the same idealised source intensity:
| Vertical source-to-table distance | 90° nominal beam diameter | Relative centre illuminance |
|---|---|---|
| 0.75 m | 1.50 m | 144% |
| 0.90 m | 1.80 m | 100% |
| 1.20 m | 2.40 m | 56% |
At 0.75 m the nominal beam is more concentrated and the centre illuminance from the same intensity increases. At 1.20 m the beam reaches farther, but centre illuminance falls to roughly 56 per cent of our 0.90 m reference.
The engineering consequence is more useful than any single number: mounting height and optical distribution cannot be specified independently. If the luminaire is moved upward, the designer may need a different distribution or different intensity. If it is lowered, visual comfort and the seated sightline may become more important even though the tabletop receives more light.
A large diffuse pendant, linear luminaire or multi-source chandelier will not behave exactly like the idealised point source in this equation. Actual photometric data should therefore replace these geometric approximations during specification.
Technical reference: IES — Inverse-square law
PAGE 8
The Average Can Be Right While The Distribution Is Wrong
Suppose we install the luminaire and measure several points on the tabletop. If the arithmetic average is exactly 100 lux, it may appear that our design target has been achieved. Average illuminance, however, tells us nothing by itself about how those readings are distributed across the table.
The CIE defines illuminance uniformity Uo as the quotient of the minimum illuminance and average illuminance over a surface:
Uo = Emin / Eavg
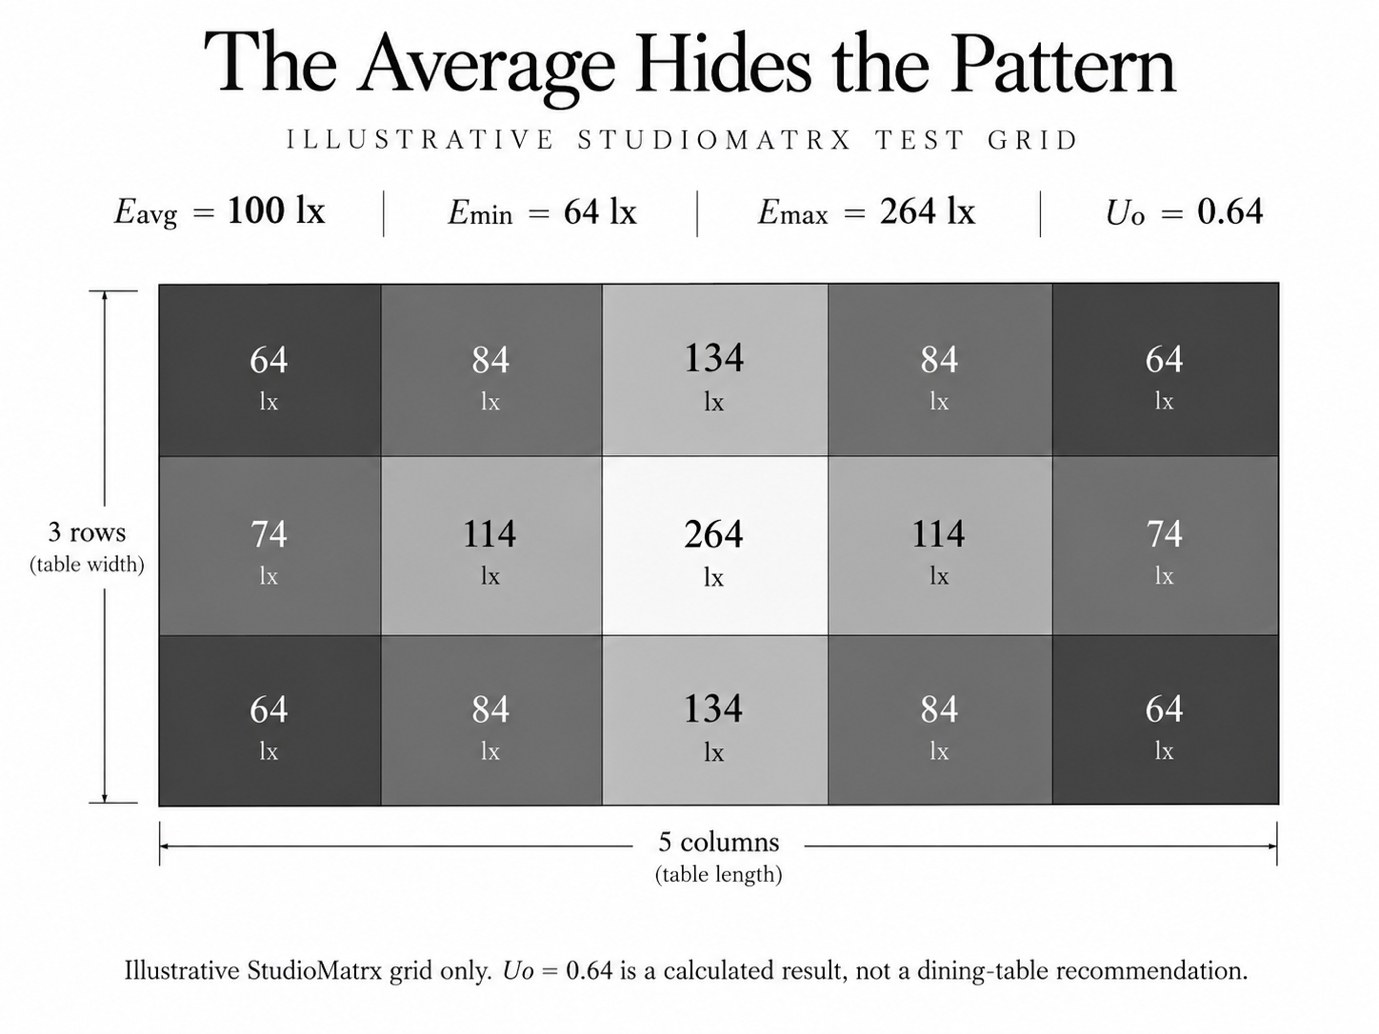
Consider the following invented StudioMatrx measurement grid. These are not readings from a product or a recommended distribution; they are deliberately constructed numbers for explaining the calculation.
| 64 | 84 | 134 | 84 | 64 |
| 74 | 114 | 264 | 114 | 74 |
| 64 | 84 | 134 | 84 | 64 |
The fifteen readings average exactly:
Eavg = 100 lx
while:
Emin = 64 lx
and:
Emax = 264 lx
Therefore:
Uo = 0.64
The point is not that 0.64 is a required dining-table uniformity value. It is not being presented as one. The point is that an installation can achieve our 100-lux average while the brightest reading is more than four times the darkest reading.
Average illuminance therefore cannot describe the visual pattern by itself. A tight pendant can produce a strong central pool while leaving the table ends comparatively subdued. Another distribution may create a much smaller centre-to-edge difference while producing exactly the same average.
Technical reference: CIE — Illuminance uniformity
PAGE 9
One Hundred lux Does Not Make Every Table Look Equally Bright
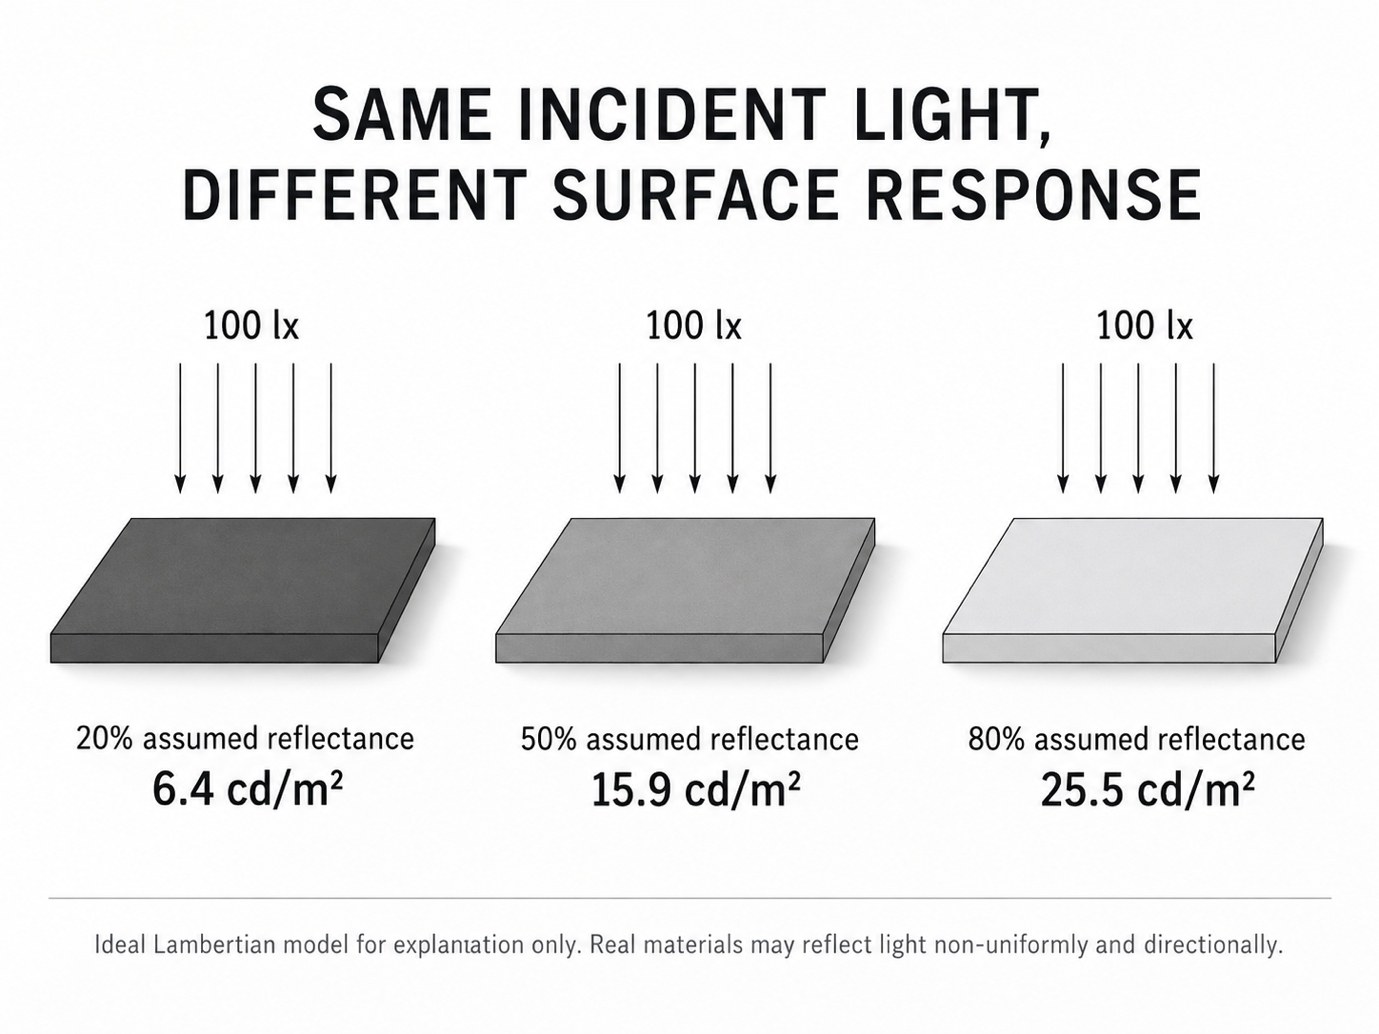
Until now, we have been discussing light arriving on the table. The appearance of the table introduces another photometric quantity: luminance, which is related to the light leaving or being transmitted through a surface in a specified direction. Two surfaces can receive the same illuminance and still look very different because they reflect light differently.
For a deliberately simplified ideal Lambertian surface, the IES gives the relationship:
M = ρ × E
where M is luminous exitance, ρ is reflectance and E is illuminance. For an ideal Lambertian diffuser, luminance is related to luminous exitance by L=M/π. The IES also explicitly warns that real surfaces do not follow the Lambertian model perfectly and that many depart substantially from it.
If our hypothetical surface receives 100 lux, then under this idealised diffuse model:
| Assumed diffuse reflectance | Calculated ideal diffuse luminance |
|---|---|
| 20% | 6.4 cd/m² |
| 50% | 15.9 cd/m² |
| 80% | 25.5 cd/m² |
The table in all three examples still receives 100 lux. What changes is how much light the simplified surface returns. This is why a pale matte tabletop, a dark timber table and a dark stone table cannot be expected to appear equally luminous merely because the lux meter gives the same reading.
Real materials complicate the relationship further. Polished stone, lacquer, glass and highly finished timber may introduce directional or specular reflection rather than behaving like perfect diffuse surfaces. A measurement of incident illuminance does not reveal whether the diner can see an image of the pendant reflected from the tabletop.
Surface finish therefore belongs inside the lighting calculation rather than being treated as a separate decorative decision.
Technical reference: IES — Lambertian units and reflectance relationship
Technical reference: CIE — Luminance definition
PAGE 10
Glare Is Why a Perfect lux Number Can Still Feel Uncomfortable
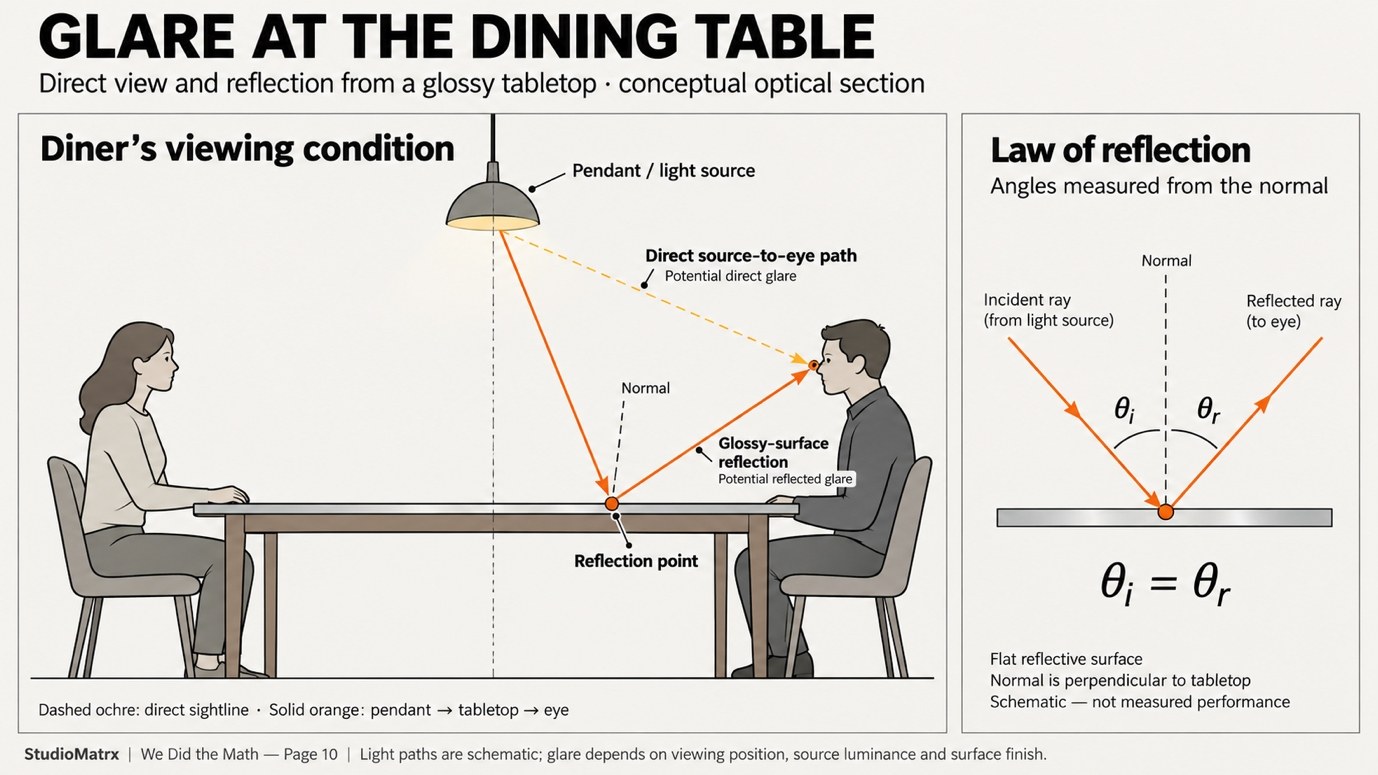
A lux meter placed horizontally on a table does not experience the room the way a seated person does. The diner sees the person opposite, the pendant above, bright parts of the luminaire, surrounding walls, tableware and reflections from the tabletop. This is why technically adequate horizontal illuminance can coexist with visual discomfort.
The IES defines glare as a sensation caused by luminances within the visual field that are sufficiently greater than the luminance to which the eyes are adapted to produce annoyance, discomfort or reduced visual performance. Its definition specifically notes that the magnitude of glare depends on characteristics including the luminance, size and position of sources and the luminance to which the eye has adapted.
This immediately explains why total lumens are insufficient. A small exposed emitter can produce relatively modest total luminous flux while having very high apparent luminance within the field of view. A larger diffusing surface may emit greater total flux but distribute that output over a larger apparent area. The number on the product box does not describe that visual relationship.
The tabletop can create another problem. The IES describes reflected glare as glare resulting from high-luminance reflections in polished or glossy surfaces within the field of view. A pendant that looks acceptable against a matte timber surface can behave quite differently above glass or polished stone if the source is reflected toward the seated eye.
Mounting height therefore enters the problem again. Lowering the pendant can intensify the relationship between source and table and may increase tabletop illuminance, but it can also place bright components closer to the seated line of sight. Raising it changes the distribution and reduces illuminance from the same intensity. The design cannot solve one variable without checking the others.
Technical reference: IES — Glare definition
Technical reference: IES — Reflected glare definition
PAGE 11
What Would We Need Before Specifying The Real Pendant?
At this point, a product lumen figure should begin to look much less decisive. A useful specification would need to tell us not only how many lumens the luminaire produces, but how those lumens are distributed. The most useful information therefore includes the luminous intensity distribution, the nominal beam and field behaviour where applicable, the mounting geometry and enough photometric information to predict illuminance at multiple points on the table.
The distinction between luminous flux and luminous intensity is important here. Lumens describe total luminous flux; luminous intensity, measured in candela, describes flux distributed in a particular direction per unit solid angle. The IES definition makes clear why intensity data becomes necessary once we want to calculate the illuminance at a particular point rather than simply total source output.
For a real project, the calculation should therefore move from our simplified cone diagrams to the manufacturer’s photometric file or intensity distribution. The centre, table ends and corners can be tested rather than assuming that everything within the nominal beam angle receives equal illumination. The selected table material and finish should also be represented as accurately as practical because reflected light contributes to the visual condition of the room.
The design intent must then be tested against the people using the table. Is the source visible from normal seated positions? Does a diffuser sufficiently shield high-luminance emitters? Does a polished surface reflect the luminaire toward the eye? Does the table remain excessively contrasted against the surrounding room? Does the proposed dimming range allow the condition to change between normal dining, larger gatherings and other uses of the space?
The answer to “Which pendant should we buy?” therefore appears very late in the process. The calculation first establishes the target surface and geometry; the photometry then predicts distribution; and the architecture determines whether the visual result works for the people around the table.
Technical reference: IES — Luminous intensity definition
PAGE 12
So, How Much Light Does The Table Actually Need?
For our StudioMatrx worked example, the clean mathematical statement is that a 1.80 m × 0.90 m table has an area of 1.62 m², and our chosen 100-lux test average corresponds to 162 lumens of luminous flux incident on that surface.
That answer is mathematically correct and practically incomplete.
It cannot tell us whether the luminaire should be rated at 270 lumens, 400 lumens, 600 lumens or considerably more, because the total source flux and the flux actually reaching the table are different quantities. It cannot tell us whether a beam reaches the corners evenly. It cannot tell us whether the fixture is mounted too high or too low. It cannot tell us how a dark timber top will appear compared with pale stone. It cannot tell us whether an exposed LED will produce glare for the person seated opposite.
The beam-angle calculation showed why. At our assumed 0.90 m mounting distance, the geometric cone required merely to reach the four corners is approximately 96.4 degrees. Yet an IES beam angle is defined at the directions where intensity has already fallen to 50 per cent of maximum. Reaching the corners is therefore not equivalent to delivering equal illuminance to them.
The mounting-height calculation introduced another trade-off. Raising the same idealised source expands the footprint while reducing illuminance through the inverse-square relationship. Lowering it has the opposite effect but may alter the seated visual relationship with the luminaire. Distribution and distance therefore have to be solved together rather than sequentially.
The uniformity test then demonstrated how misleading one average can be. Fifteen hypothetical readings produced exactly 100 lux average while ranging from 64 to 264 lux. Nothing about the average alone revealed that pattern. The surface calculation showed that even when incident illuminance remains identical, different reflectance can produce very different surface luminance. The glare discussion finally showed why neither illuminance nor lumens describes the entire visual field.
That leaves us with a much more useful answer than a product wattage or lumen number. The table does not simply need “X lumens.” It needs an intended illuminance condition produced with an appropriate distribution, from an appropriate position, on a known surface, while remaining visually comfortable for the people using it.
The calculation gives us the starting quantity. The photometric data tells us whether the luminaire can deliver it. The architecture tells us whether the result works. And that is precisely why “How many lumens?” should never be the only lighting question.
Try the Calculation — Student Exercise
Consider the same dining table measuring 1.80 m × 0.90 m, with a surface area of 1.62 m².
Instead of the original 100 lux test assumption, use 150 lux.
Calculate the luminous flux required to reach the tabletop.
Calculation:
150 lux × 1.62 m² = 243 lumens
This is the luminous flux required to arrive on the tabletop, not the total output required from the luminaire.
Now consider: Why can’t we select a pendant based only on this result? What additional information about light distribution, mounting height and visual comfort would we need?
This is a hypothetical educational exercise, not a recommended dining-table illumination level.
Research Sources & Technical References
All numerical test targets, hypothetical light-delivery fractions and illustrative grids in the article are StudioMatrx educational assumptions, not lighting recommendations or documented measurements.
1. Illuminance and lux
International Commission on Illumination (CIE) — International Lighting Vocabulary: Illuminance
https://cie.co.at/eilvterm/17-21-060
2. Lux as a measurement unit
National Institute of Standards and Technology (NIST) — Lux
https://www.nist.gov/glossary-term/26871
3. Indian lighting code
Bureau of Indian Standards (BIS) — SP 72:2025, National Lighting Code of India (BIS technical overview)
https://www.bis.gov.in/wp-content/uploads/2025/10/BIS-NEWSLETTER-OCTOBER-2025.pdf
4. Residential lighting reference
Illuminating Engineering Society (IES) — ANSI/IES/ALA RP-11-26, Lighting for Interior and Exterior Residential Environments (2026)
5. Historical restaurant dining-light context
IES — Brett Andersen, The Secret Recipe for Restaurant Lighting (2018)
https://ies.org/lda/the-secret-recipe-for-restaurant-lighting-2/
6. Beam angle
IES — Beam Angle Definition (50% of peak intensity)
https://ies.org/definitions/beam-angle/
7. Field angle
IES — Field Angle Definition (10% of peak intensity)
https://ies.org/definitions/field-angle/
8. Off-axis illuminance
IES — Cosine-Cubed Law
https://ies.org/definitions/cosine-cubed-law/
9. Mounting distance and illuminance
IES — Inverse-Square Law
https://ies.org/definitions/inverse-square-law/
10. Illuminance uniformity
CIE — International Lighting Vocabulary: Illuminance Uniformity
https://cie.co.at/eilvterm/17-29-160
11. Reflectance and ideal diffuse surfaces
IES — Lambertian Units of Luminance
https://ies.org/definitions/lambertian-units-of-luminance/
12. Luminance
CIE — International Lighting Vocabulary: Luminance
https://cie.co.at/eilvterm/17-21-050
13. Visual glare
IES — Glare Definition
https://ies.org/definitions/glare/
14. Reflected glare
IES — Reflected Glare Definition
https://ies.org/definitions/reflected-glare/
15. Photometric distribution and specification
IES — Luminous Intensity Definition
https://ies.org/definitions/luminous-intensity/
Editorial source note. The BIS and IES standard links identify published standards. Full technical tables may require access to the purchased standards; no current dining-table target is claimed from them.