
 Lesson 1.4
Lesson 1.4 · Reading the City
Mapping & Site Analysis
Base maps, layers, OpenStreetMap, and how to truly read an urban site
A map is an argument, not a mirror
Every map leaves things out, and what it leaves out is a decision. The skill of urban site analysis is choosing which layers to draw, reading what they reveal together, and turning that reading into a proposal the site itself seems to ask for.
The best data layer is your own two feet. Always ground-truth.
Building an honest base map
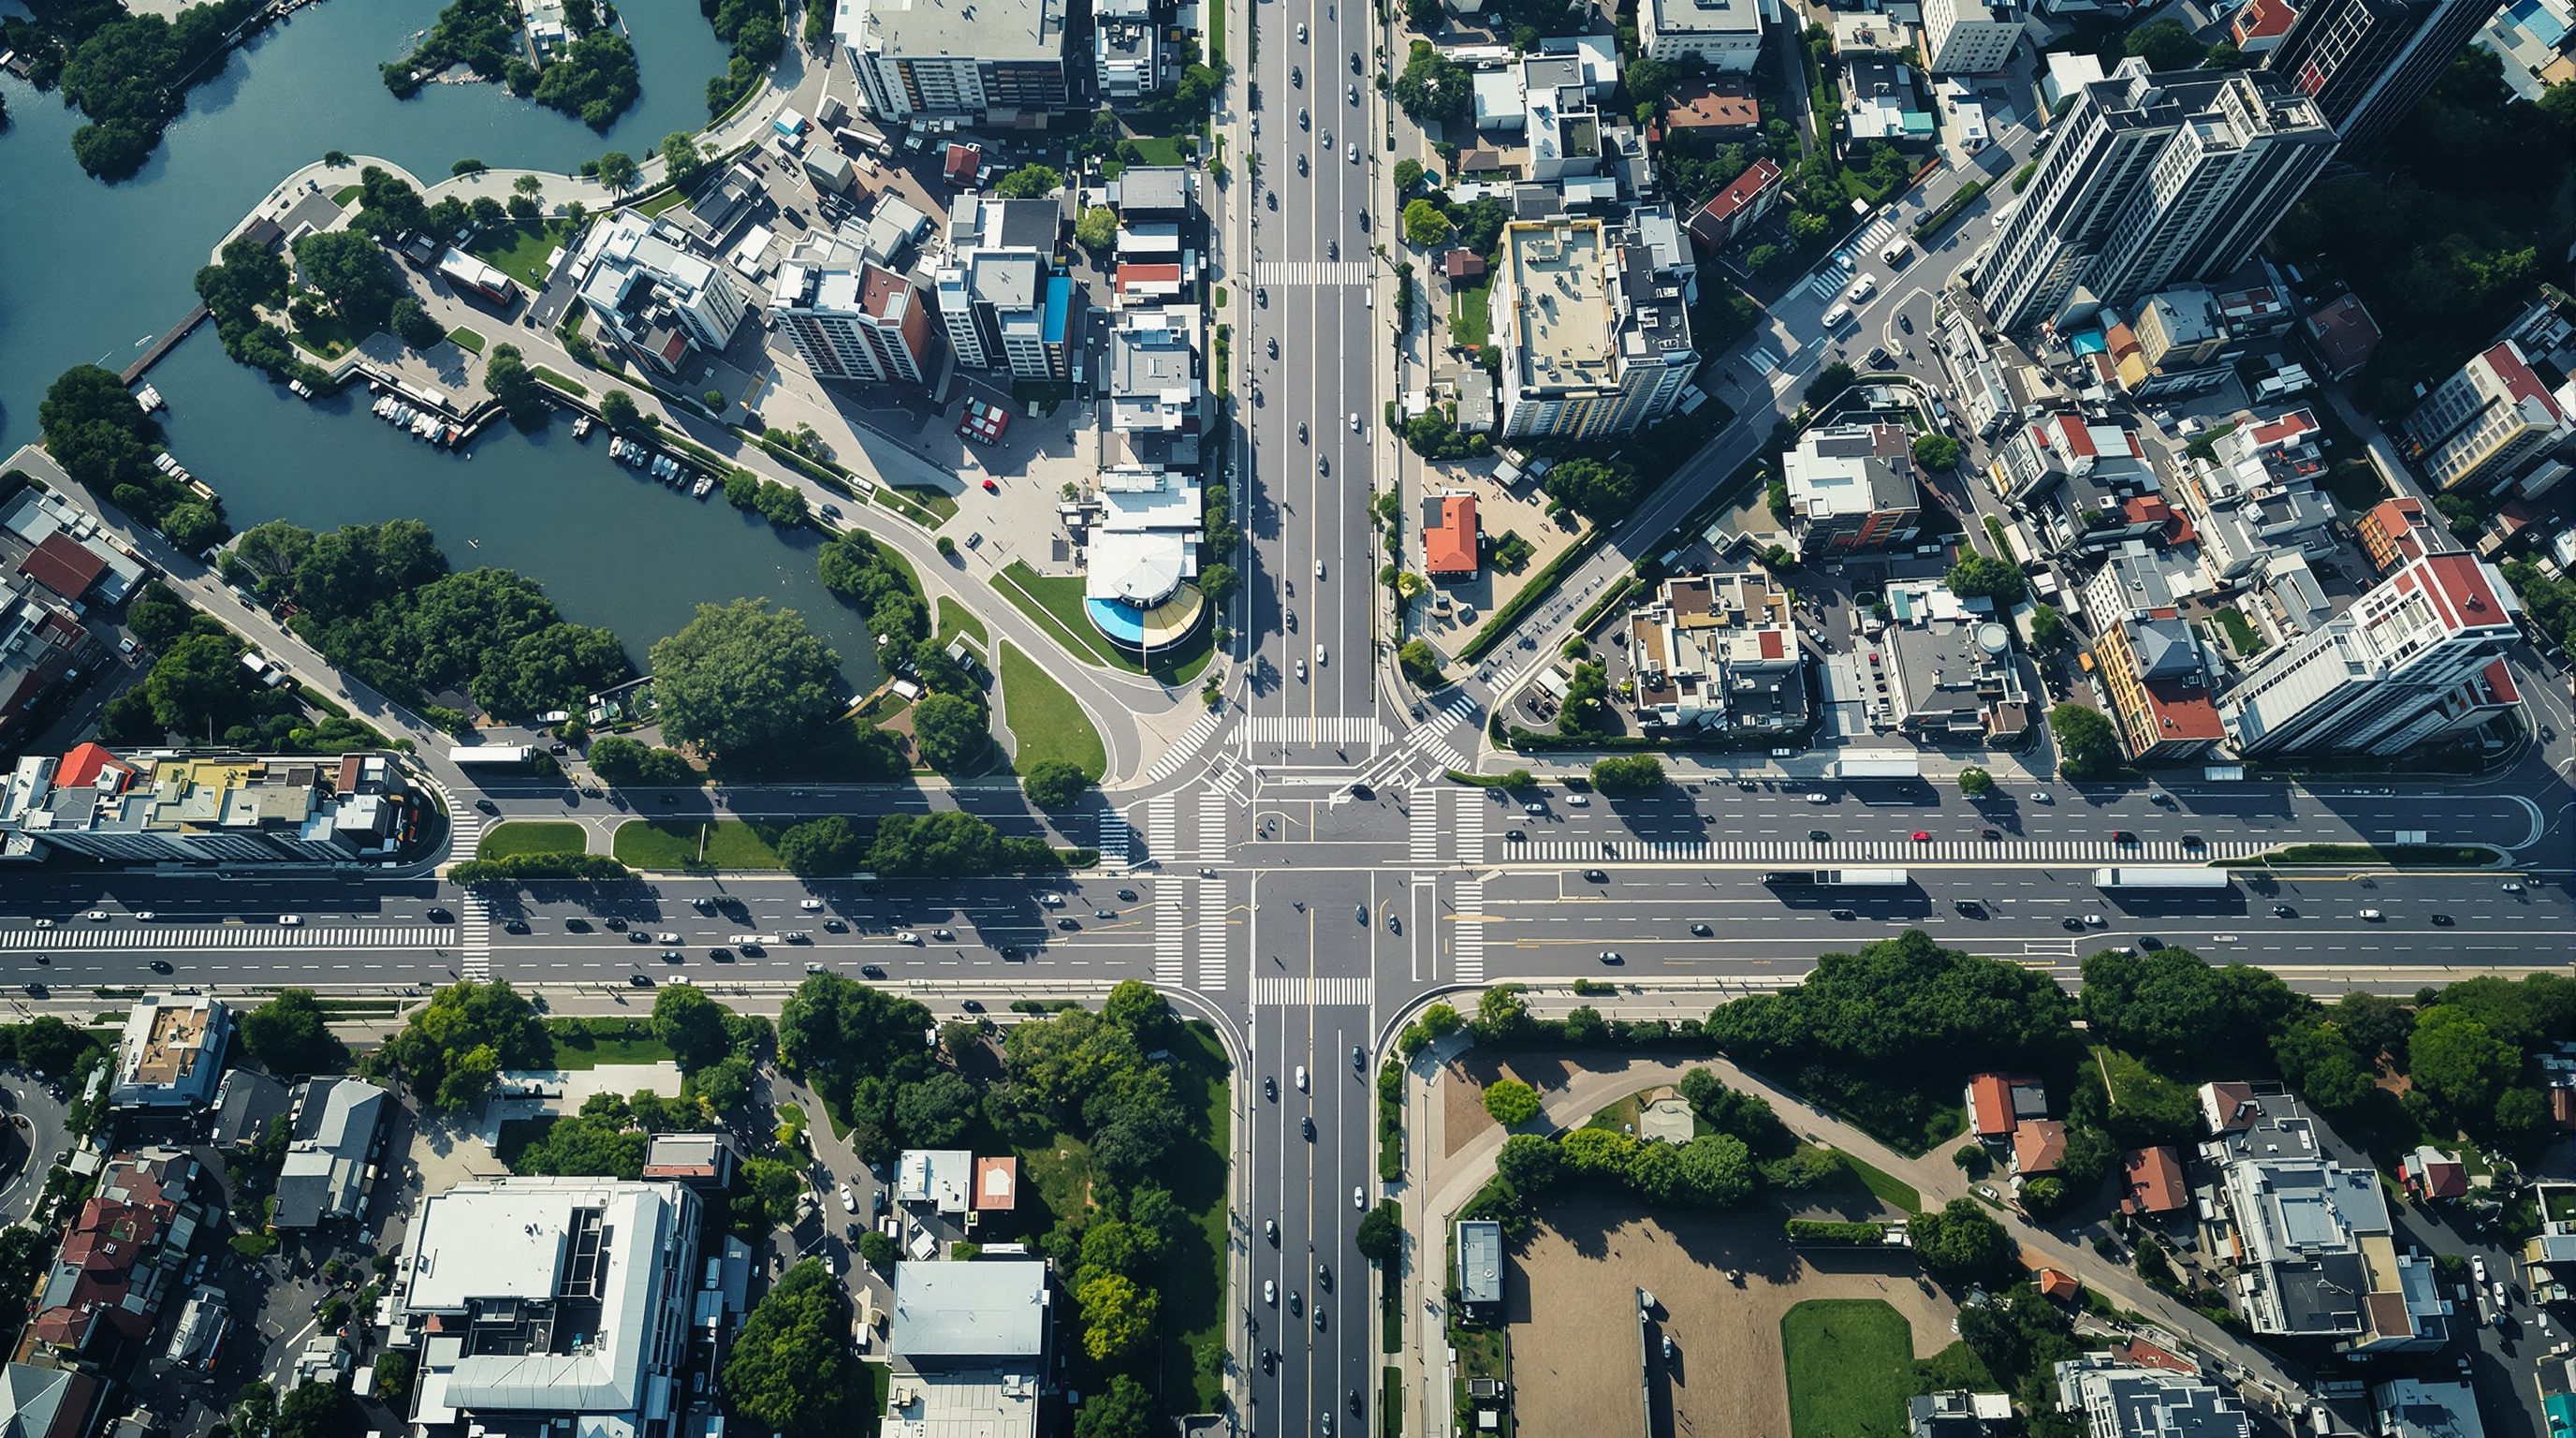
All urban analysis stands on a base map, the accurate, scaled drawing of the physical facts of a place onto which every other layer is registered. A good base map shows at least the street network, building footprints, plot or parcel boundaries, water, open space, and contours or spot levels, all georeferenced so they line up. In India the raw material comes from several sources that rarely agree perfectly: Survey of India toposheets for terrain and the regional frame, municipal or development-authority cadastral and master-plan maps for plots and land use, and increasingly OpenStreetMap and high-resolution satellite imagery for current footprints and roads. The first discipline of analysis is therefore reconciliation: overlaying these sources, noticing where they disagree, and deciding which to trust for each feature. A map is never a neutral mirror of reality; it is a selective argument, and every base map embeds choices about scale, extent, and what counts as worth drawing. Choosing the study extent is itself an analytical act, because a site's real influences, its catchment, its watershed, its transport corridor, almost always spill beyond the red line of the plot. Draw too tight a boundary and you will miss the forces that actually govern the site; draw the base map at the scale of the question, not the scale of the property.
The layer-cake method
The most durable idea in site analysis is the layer cake, popularised by Ian McHarg in Design with Nature in 1969 and now the everyday logic of every geographic information system. Instead of one crowded drawing, you separate reality into thematic layers, one each for topography, hydrology, vegetation and ecology, land use, movement, ownership, and so on, then stack them so patterns emerge from their overlay. McHarg used this to find the least-cost, least-harm route for roads by overlaying constraint layers until the clear corridors revealed themselves, an early form of what GIS now calls suitability analysis. The power of the method is that it disaggregates a confusing whole into legible parts and then lets you recombine them deliberately. In practice you build these layers in a tool like QGIS, the leading free and open-source GIS, or a commercial platform such as Esri's ArcGIS, pulling geometry from OpenStreetMap, government open-data portals, and your own survey. The layers you choose are an argument about what matters: a flood-resilience project foregrounds hydrology and levels; a high-street revival foregrounds ground-floor uses, footfall, and frontage. Discipline yourself to keep each layer clean and single-themed, because the insight comes not from any one layer but from the moment two of them line up, when the low ground turns out to be exactly where the informal settlement sits, or the dead frontage exactly where the block is oversized.
OpenStreetMap and the modern toolkit
OpenStreetMap has transformed urban analysis, especially in India, where official large-scale digital data can be patchy or costly. It is a free, editable world map built by volunteers, with tagged geometry for roads, buildings, land use, amenities, water, and much else, downloadable and usable in any GIS. For a student or a small practice it means you can assemble a credible base map of almost any Indian city in an afternoon, extracting the street network for a permeability study, the building footprints for a figure-ground, and points of interest for a land-use or amenity map. Its limits must be respected: coverage and accuracy vary from city to city and even neighbourhood to neighbourhood, footprints may be missing or dated, and informal areas are often under-mapped, so ground-truthing by walking the site remains essential. Pair OpenStreetMap with satellite imagery to check and complete footprints, with census data for population and demographics, and with your own field survey for the things no dataset holds, the smell of the drain, the shade of a tree, the informal cricket pitch, the direction people actually walk. The best analysts treat digital data as a first draft to be corrected on foot, never as the truth.
Reading movement, uses, ecology, and people
A thorough urban site reading works through several families of question. Movement: how do people and vehicles get to and through the site on foot, by cycle, by bus or metro, by car, where are the desire lines and the barriers, and what is the walking catchment, typically the area within a five-to-ten-minute walk of a station or centre? Uses and activity: what happens where, when do streets fill and empty, where is the active frontage and where the dead edge, and what is missing that people must travel far to find? Ecology and environment: where does water flow and pool, where are the trees and green, which way does the sun and the prevailing wind come, and where is it hot, noisy, or polluted? People and meaning: who uses this place, who is excluded, what do residents value, and what carries memory or sacred significance, the temple tank, the old banyan, the market that has met on the same spot for generations? Kevin Lynch's five elements, paths, edges, districts, nodes, and landmarks, give a ready vocabulary for the perceptual layer, mapping how the place is held in the mind, not just on the ground. A reading that covers movement, use, ecology, and meaning, drawn and then checked on foot, is what turns raw layers into understanding.
Mapping time, not just space
A frequent blind spot is treating the site as a still photograph when it is really a film. Cities pulse across the day, the week, and the year, and a layer that maps time often explains more than any static drawing. A market street that is choked and thrilling at nine in the morning may be a shuttered canyon by nine at night; a school gate is a bottleneck for twenty minutes and empty for the rest of the day; a floodplain is dry ground for eleven months and a lake in the monsoon. Mapping these rhythms, by returning to the site at different hours and seasons, or by using proxies such as transit timetables, festival calendars, and rainfall records, reveals conflicts and opportunities invisible on a single visit. Historical time matters too: comparing old toposheets, cadastral records, and past imagery against the present shows how the fabric arrived at its current state and which changes are accelerating, the tank being encroached, the orchard being subdivided, the ground floors turning from homes to shops. Overlaying yesterday on today is the site-scale version of the morphological reading you learned earlier, and it protects you from designing brilliantly for a moment that does not last. Ask always not only what is here but when, and the site becomes far harder to misread.
Visit at 9am and 9pm. Same street, two cities.
Statutory maps and the Indian context
In the Indian setting, site analysis must also read the statutory landscape, because what you may do is as much a fact of the site as its slope. The master plan or development plan prepared under the state Town and Country Planning Act and guided by the URDPFI Guidelines assigns each parcel a land-use zone and a set of Development Control Regulations, including Floor Space Index, setbacks, and heights, which together define the development envelope. Alongside these sit special layers: coastal regulation zones near the sea, heritage listings that constrain change in a precinct, transit-oriented development zones along metro corridors that permit higher density, and mission programmes such as AMRUT and the Smart Cities Mission that may bring funds and rules to particular areas. The 74th Constitutional Amendment devolves urban planning powers to elected urban local bodies and mandates ward committees and district planning, so the institutional map, who actually decides, is part of the analysis too. Treat every statutory claim carefully and verify it with the local development authority, because zoning, FSI, and precinct rules vary by state and city and change over time. The mature analyst maps not only the physical and social site but the regulatory and institutional one, because a brilliant proposal that the plan forbids is not yet a proposal.
Zoning is a layer of the site too. What you may build is a fact, like the slope.
From analysis to a design-ready synthesis
Analysis that stays a pile of layers is useless; its purpose is a synthesis that points to design. The classic device is the constraints-and-opportunities plan, a single drawing that distils all the layers into what must be protected or avoided, the flood line, the heritage frontage, the mature trees, the noisy edge, and what invites action, the underused plot, the missing connection, the blank frontage on a busy street, the sunny sheltered corner. A companion urban SWOT, strengths, weaknesses, opportunities, threats, can structure the narrative. The discipline is to be selective and argumentative: a synthesis diagram makes a claim about what the site is really about, and it should be legible in one glance to a client or a community. From here the leap to design is short, because a good synthesis almost proposes the scheme for you, showing where movement should be added, where the block should be broken, where density belongs and where it does not. Site analysis, done honestly, is not a hoop to jump through before the real work; it is the first act of design, the moment the designer stops imposing and starts listening to what the place, its people, and its rules are already saying.
URDPFI Guidelines and the state Town and Country Planning Acts
Master and development plans, land-use zoning, and plan hierarchy in India
Define the statutory land-use and control layer that every urban site analysis must map and verify with the local authority.
74th Constitutional Amendment Act
Devolution of urban planning to urban local bodies, ward committees, district planning
Frames the institutional map, who actually decides, which is part of a full site reading.
OpenStreetMap and open GIS (QGIS, Esri ArcGIS)
Base geometry, layered mapping, and suitability analysis
The practical toolkit for assembling and interrogating layers; treat open data as a first draft to ground-truth.
Read a site in seven layers
You will build a layered base map of a real urban site and distil it into a design-ready synthesis.
QGIS, OpenStreetMap, satellite imagery, the local master or development plan, notebook and camera for fieldwork
Choose a site of roughly 5 to 20 hectares that you can visit, and set a study extent wider than the plot.
- 1Assemble a georeferenced base map in QGIS from OpenStreetMap and satellite imagery: streets, footprints, plots, water, open space, and levels.
- 2Add at least four clean single-theme layers: movement and catchment, land use and activity, ecology and levels, and the statutory zoning and constraints from the local plan.
- 3Walk the site and correct the map, recording desire lines, active and dead frontages, trees, hot or noisy spots, and what people value.
- 4Distil everything into a one-page constraints-and-opportunities plan and a short urban SWOT that makes a clear claim about what the site is about.
You’ll walk away with
A layered base map, a marked-up ground-truthing sketch, and a single legible constraints-and-opportunities synthesis with an urban SWOT.
Three altitudes on the same idea
Read the band that fits you — or all three.
Do not start massing until you have built a layered base map and a constraints-and-opportunities synthesis, and until you have walked the site to check the data. The synthesis will hand you the moves the site is asking for: the frontage to hold, the level to respect, the view and breeze to catch, the regulatory envelope to work within. A design grounded in a real reading needs far less special pleading later.
For the urban designer, mapping is the medium in which you both understand and argue. Choose the study extent at the scale of the forces, not the property line, build clean single-theme layers in QGIS from OpenStreetMap and government open data, and always ground-truth on foot. Your constraints-and-opportunities plan is a political document as much as a technical one, so make it legible to the community and honest about who currently wins and loses on the site.
Learn one GIS, QGIS is free, and one habit: separate reality into clean layers, then look for where two layers line up. Build a base map of a site you know from OpenStreetMap and satellite imagery, add movement, use, and ecology layers, then walk the site and correct your map. Finish with a one-page constraints-and-opportunities diagram; that single drawing is the whole skill in miniature.
“Site analysis is just collecting all the data and maps you can find about a place.”
Do it yourself
Quick checks on reading a site.
- 1For a site you know, name the study extent you would draw and justify why it is wider than the plot.
- 2List four layers you would map first for a flood-resilient neighbourhood versus a high-street revival, and explain the difference.
- 3Identify one place where two layers line up on your site, such as low ground meeting informal housing or dead frontage meeting an oversized block.
Pulling it together
Peer-reviewed journals & authoritative standards
- 01Ian L. McHarg, Design with Nature (the layer-cake method) — Wiley, 1969.
- 02OpenStreetMap, the free editable map of the world — OpenStreetMap Foundation, 2024.
- 03QGIS, free and open-source geographic information system — QGIS project, 2024.
- 04URDPFI Guidelines, Town and Country Planning Organisation — TCPO, Ministry of Housing and Urban Affairs, 2015.
You can now read a city's form and read a site; the next module turns from reading to shaping, beginning with the street and the public realm.
The author
Amogh N P
Architect, interior designer, and creative polymath. Studio Matrx began in his notebooks — his vision of design made honest, useful, and open to everyone. Its Academy is written and taught in his memory, and free, forever.
More about Amogh →