
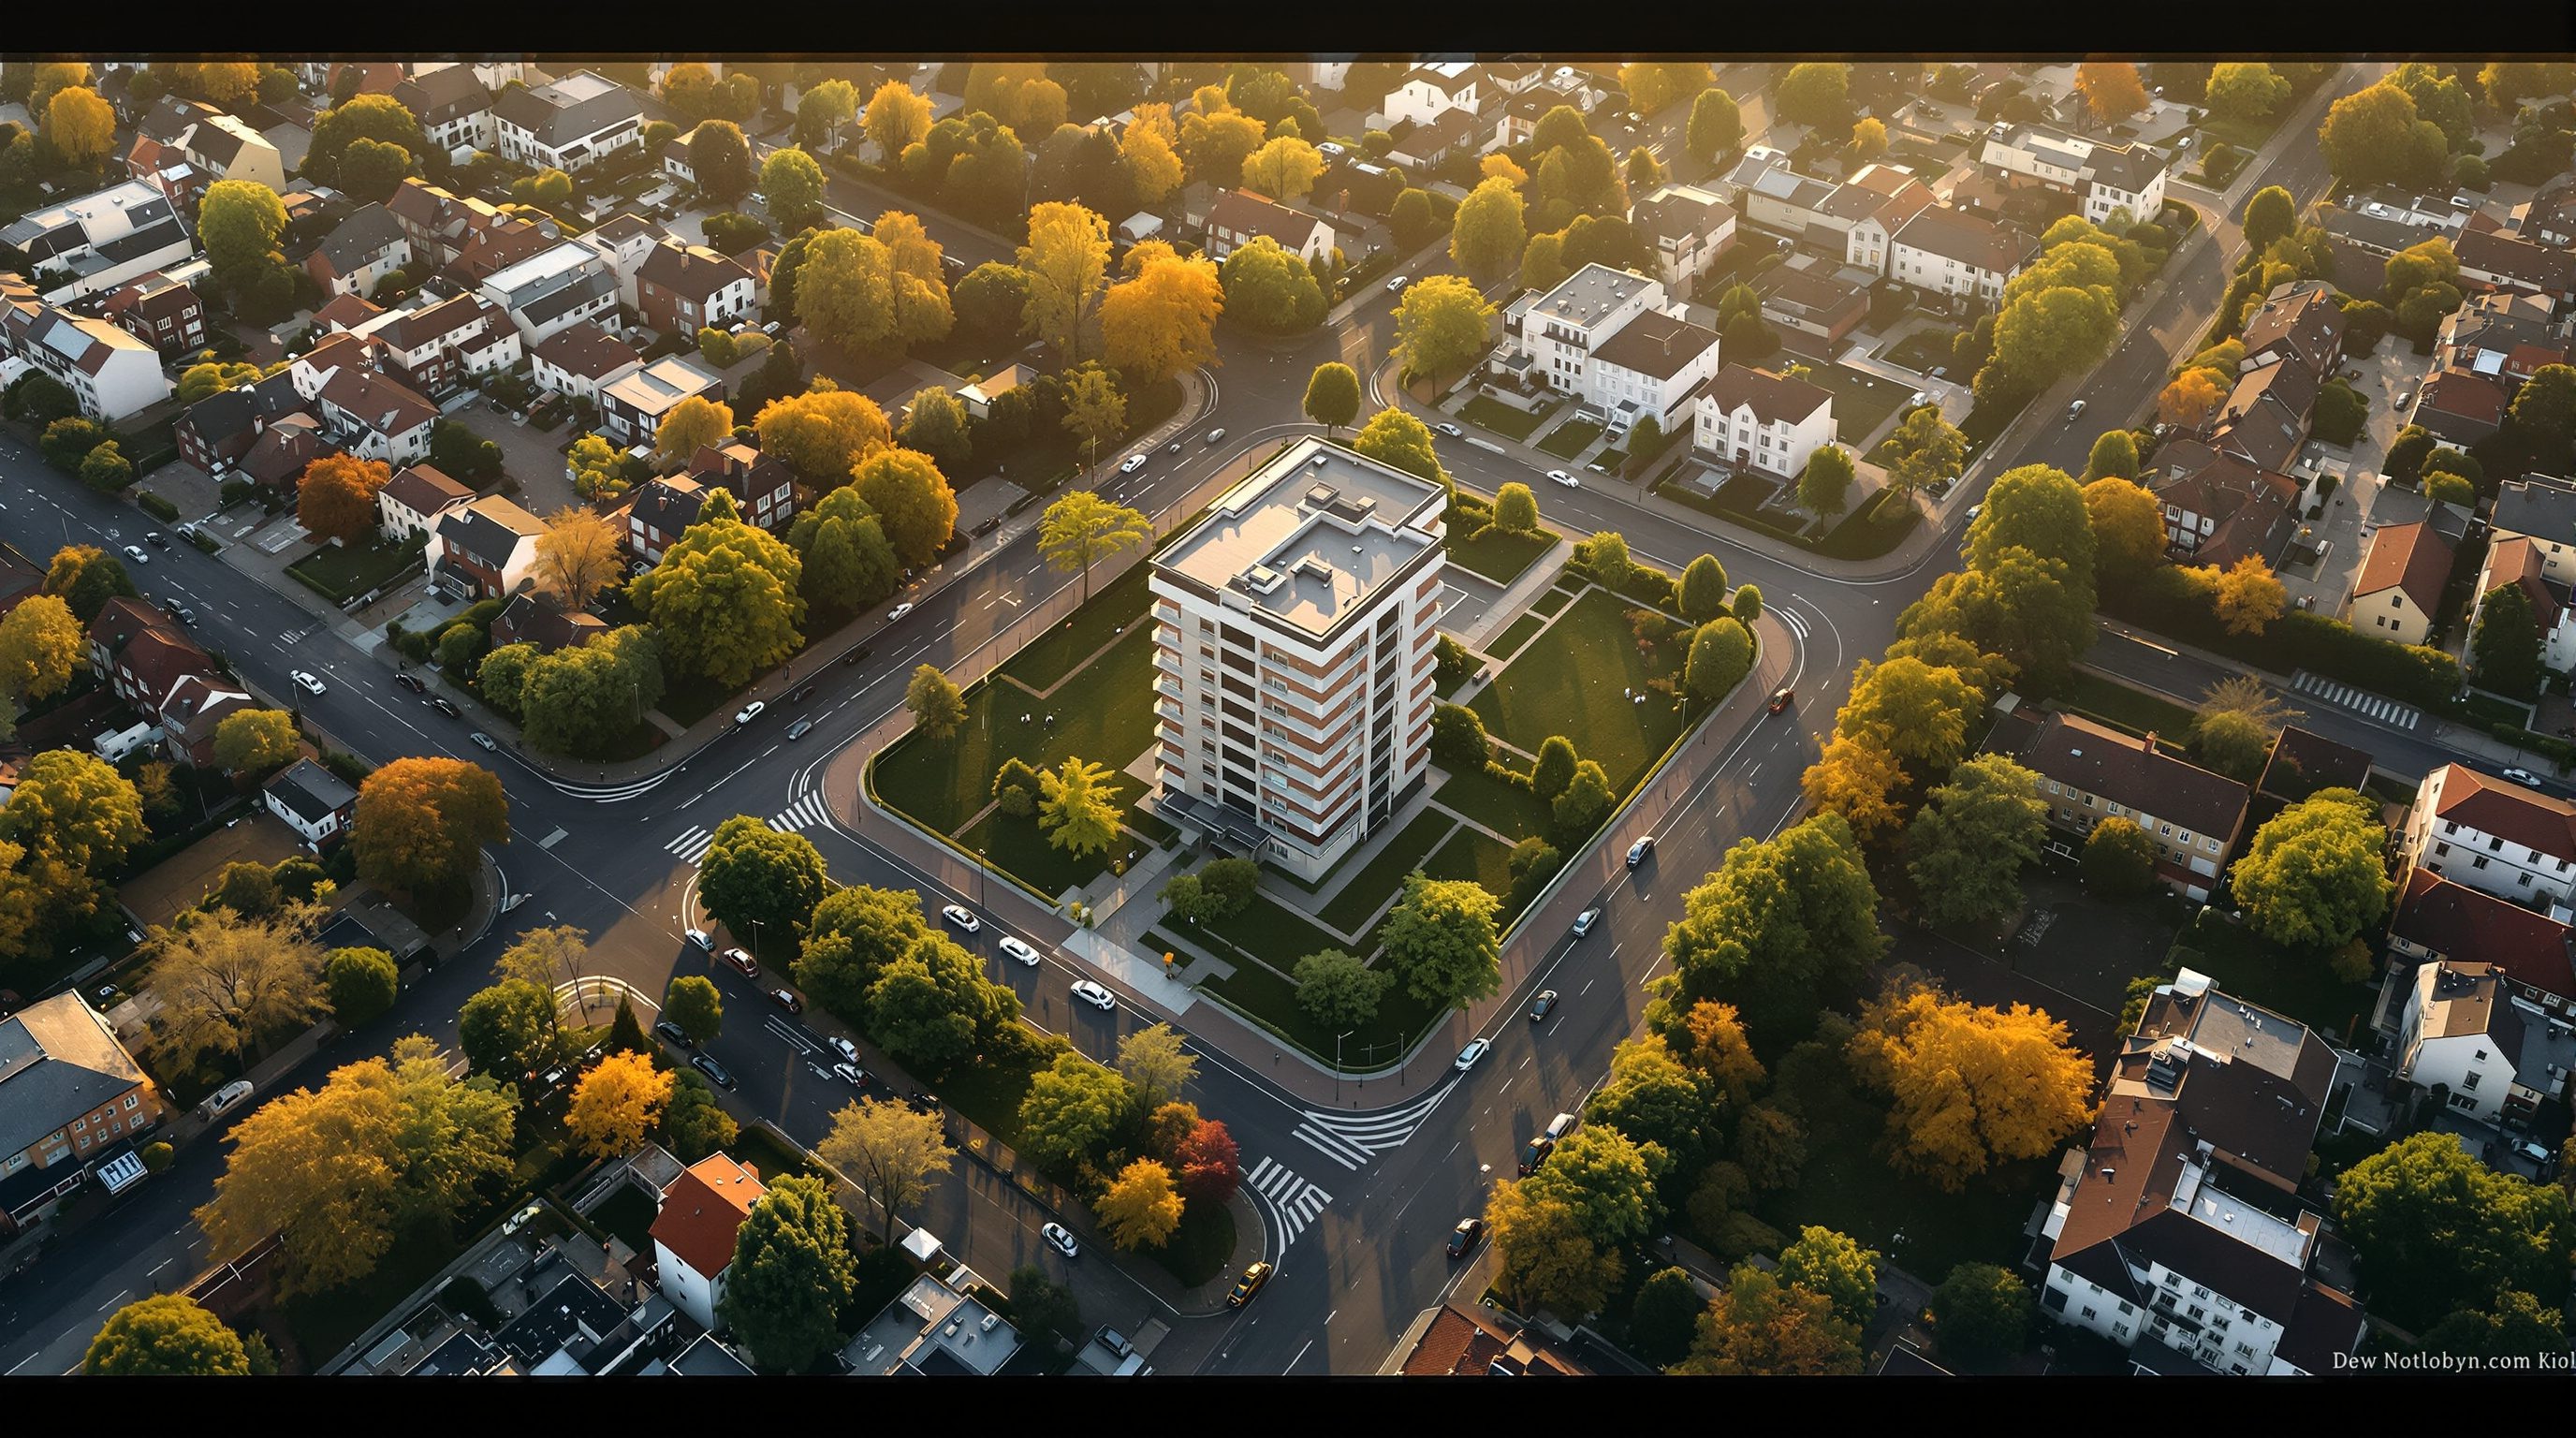
 Lesson 7.1
Lesson 7.1 · GIS for Architecture & Site Analysis
Site Context & Constraints Mapping
Reading a plot through the neighbourhood that surrounds it
You are handed a plot at the edge of the city and asked one question: is it any good?
The survey sheet shows a clean rectangle. But the rectangle is not the site - the neighbourhood is. Somewhere near it runs a nala that floods in July; a protected temple casts a heritage buffer; a ridge makes the western third too steep to build; the only bus stop is a kilometre away. A GIS lets you gather every one of those facts into a single composite, so the plot stops being a rectangle and becomes a place with opportunities and constraints you can see, count and defend.
The buildable envelope is the most honest drawing in the whole set - it is the site telling you where it will let you build.
Context is a stack of themes, each on its own sheet
A good site analysis is not one map crammed with everything; it is a set of clean, single-subject layers you can read one at a time and then combine. Think of the site's world as separated into themes: access (roads, transit, walking distance to a station), amenities (schools, clinics, markets within reach), hazards (flood lines, steep slopes, high-tension lines, contaminated ground), heritage (protected monuments and the statutory buffers around them), and ecology (waterbodies, tree cover, drainage paths, wetlands).
Each theme is a layer, and each layer answers a different question about the plot. Loaded together, they turn a bare boundary into a briefing. The discipline is to keep them separate first - a flood layer that has been mixed into a road layer can never be re-weighted or switched off - and only then to overlay them. That separation is the whole reason we do this in a GIS rather than on a single traced sheet.
A site plan that shows only the plot is a portrait with the background painted out.
From constraints to a composite: the overlay
The move that made GIS famous in design came from Ian McHarg's Design with Nature (1969): draw each constraint on a transparent sheet, stack the sheets, and the darkest areas - where constraints pile up - are the places to avoid. GIS does this arithmetically and instantly. You mark each constraint as a zone (a flood polygon, a heritage-buffer ring, a steep-slope patch), then combine them so the plot is divided into no-build ground and what remains: the buildable envelope.
In practice you build constraint zones with two everyday operations you have met earlier in the course: the buffer (a distance band - say, a 100 m no-build ring around a protected monument, or a 30 m margin from the top of a stream bank) and the overlay (combining layers so you can select the ground that satisfies every rule at once). The output is not a pretty picture; it is a defensible statement: this is where a building may legally and sensibly go.
Not every layer counts the same: weighted suitability
Some constraints are absolute - you do not build inside a flood line or a heritage buffer, full stop. Those are exclusions: the ground is simply removed. But many site factors are matters of degree. A gentle slope is better than a steep one but not forbidden; closer to transit is better than far but not mandatory. For these you move from hard exclusion to weighted suitability: score each factor from good to poor, decide how much each one matters (its weight), and combine the weighted scores into a single suitability surface.
The honesty test here is the weights. If access matters twice as much as ecology on this brief, say so, write the numbers down, and be ready to defend them - because someone will change them and watch the answer move. A structured way to set defensible weights is the Analytic Hierarchy Process (Saaty, 1977), where you compare factors two at a time. The technique matters less than the principle: the map is only as objective as the weights you fed it, so make them explicit.
Change the weights, change the 'best' site. That is not a bug - it is the argument, made visible.
Getting the layers, honestly, in India
You can assemble most of a site briefing for an Indian plot from free data. OpenStreetMap gives you roads, footpaths, and many amenities as clean vector features (use the QuickOSM plugin in QGIS). ISRO Bhuvan offers thematic layers and imagery, and Survey of India Open Series Maps provide 1:50,000 topographic context. Flood and drainage lines you often derive yourself from a terrain model (the next lesson) or trace from imagery.
Be honest about the gaps. OSM completeness varies street by street; a missing amenity is not an absent one. Heritage buffers and precise flood lines are frequently statutory and must come from the local authority, not a crowd map - use open data to find and reason, then verify the legally binding lines with the master plan or the competent department. And keep everything in one projected, metre-based CRS (for much of India, a UTM zone such as EPSG:32643) so your buffers are true distances and your areas are real square metres.
ISRO Bhuvan
India's national geoportal - thematic layers and imagery for context
Free with registration; a first source for Indian site context. bhuvan.nrsc.gov.in
OpenStreetMap (OSM)
Global community vector map - roads, footpaths, amenities
Free under the ODbL (attribution + share-alike); the fastest way to get access and amenity layers. Completeness varies locally - verify.
Survey of India Open Series Maps
1:50,000 topographic sheets for national context
Free to Indian residents via Aadhaar authentication (Nakshe portal); non-commercial use.
EPSG:32643
WGS 84 / UTM zone 43N - a projected metre-based CRS
Work here (or the correct UTM zone for your site) so buffers are true distances and areas are real square metres.
Workshop - build a buildable-envelope composite for a real plot
Pick a real plot in an Indian town and turn its surroundings into a constraint composite. You will assemble context layers, buffer the hazards, and overlay everything to reveal where a building may go.
QGIS 3.44 with QuickOSM, or ArcGIS Pro; OSM + Bhuvan imagery; a plot boundary.
Given: a plot boundary (draw it, or use a cadastral extract)
Data: OSM (roads, amenities) + Bhuvan imagery + a stream/waterbody you trace
Goal: a composite map showing exclusion zones and the remaining buildable area
Time: about 90 minutes
- 1Set the project CRS to a projected metre-based system for your site. In QGIS: Project ▸ Properties ▸ CRS ▸ set EPSG:32643 (or your UTM zone). In ArcGIS Pro: Map Properties ▸ Coordinate Systems ▸ choose the same UTM zone. Add a satellite base map.
- 2Load context layers. In QGIS: run the QuickOSM plugin for highway and amenity tags in your area. In ArcGIS Pro: add features from ArcGIS Living Atlas or import the same OSM extract. Trace any stream or waterbody as a new line/polygon layer over the imagery.
- 3Buffer the hazards into no-build zones. In QGIS: Vector ▸ Geoprocessing Tools ▸ Buffer (e.g. 30 m around the stream, 100 m around a heritage feature). In ArcGIS Pro: Analysis ▸ Tools ▸ Buffer with the same distances.
- 4Combine the exclusions. In QGIS: Vector ▸ Geoprocessing Tools ▸ Union (or Difference to subtract them from the plot). In ArcGIS Pro: Analysis ▸ Tools ▸ Union / Erase. What remains inside the plot is your buildable envelope.
- 5Style it for reading: exclusions in warm hatches, buildable area in a clear green, and add a short legend. Export a one-page composite you could show a client.
You’ll walk away with
A single composite map that states, from evidence, where a building may sit on the plot - plus the reusable habit of buffering hazards and overlaying exclusions.
Three altitudes on the same idea
Read the band that fits you — or all three.
This is your pre-concept homework, done in an afternoon instead of guessed at. The composite tells you the true buildable envelope - after flood, slope, heritage and access are accounted for - so your first massing sits on solid ground, literally and legally. Bring the constraint map to the first client meeting and you argue the parti from evidence, not taste.
Constraint mapping is site suitability at the parcel and sector scale. The same overlay that clears one plot, run across a whole planning area, tells you which land is developable, which must stay open, and where infrastructure should follow. It is the analytical spine beneath a land-use plan, and it makes 'no development zone' a mapped, reasoned line rather than a political one.
The context layers _are_ the public-realm brief. Walking catchments to transit and amenities, the drainage that wants to become a green corridor, the heritage setting that should shape frontages - these emerge directly from the overlay. Reading the site through its neighbourhood is how you design streets and blocks that fit the place rather than fight it.
“Site analysis in GIS just means drawing a nice base map with the surroundings on it.”
Do it yourself
No software needed - reason like a site analyst for five minutes.
- 1For a plot you know, list one layer under each theme: access, amenities, hazards, heritage, ecology.
- 2Which of your constraints are absolute exclusions (never build) and which are matters of degree (worse, not forbidden)?
- 3Pick three soft factors and assign each a weight that sums to 1.0. Justify the biggest weight in one sentence.
- 4Name one constraint line that must come from the authority, not from OpenStreetMap - and say why.
- 5Sketch, roughly, where on the plot the buildable envelope would land once your hazards are buffered out.
The one line to carry out
Peer-reviewed journals & authoritative standards
- 01McHarg, I.L. — Design with Nature — Wiley (25th Anniversary reissue), 1969.
- 02Malczewski, J. — GIS-based land-use suitability analysis: a critical overview — Progress in Planning, 2004.
- 03Saaty, T.L. — A scaling method for priorities in hierarchical structures — Journal of Mathematical Psychology, 1977.
- 04Longley, P.A., Goodchild, M.F., Maguire, D.J. & Rhind, D.W. — Geographic Information Science and Systems, 4th ed. — Wiley, 2015.
- 05Bhuvan — Indian Geoportal of ISRO — ISRO / NRSC, ongoing.
Two of the most powerful constraint layers - slope and sun - are not handed to you but computed from the terrain, so next we read solar access, slope and microclimate straight from a digital elevation model.
The author
Amogh N P
Architect, interior designer, and creative polymath. Studio Matrx began in his notebooks — his vision of design made honest, useful, and open to everyone. Its Academy is written and taught in his memory, and free, forever.
More about Amogh →