
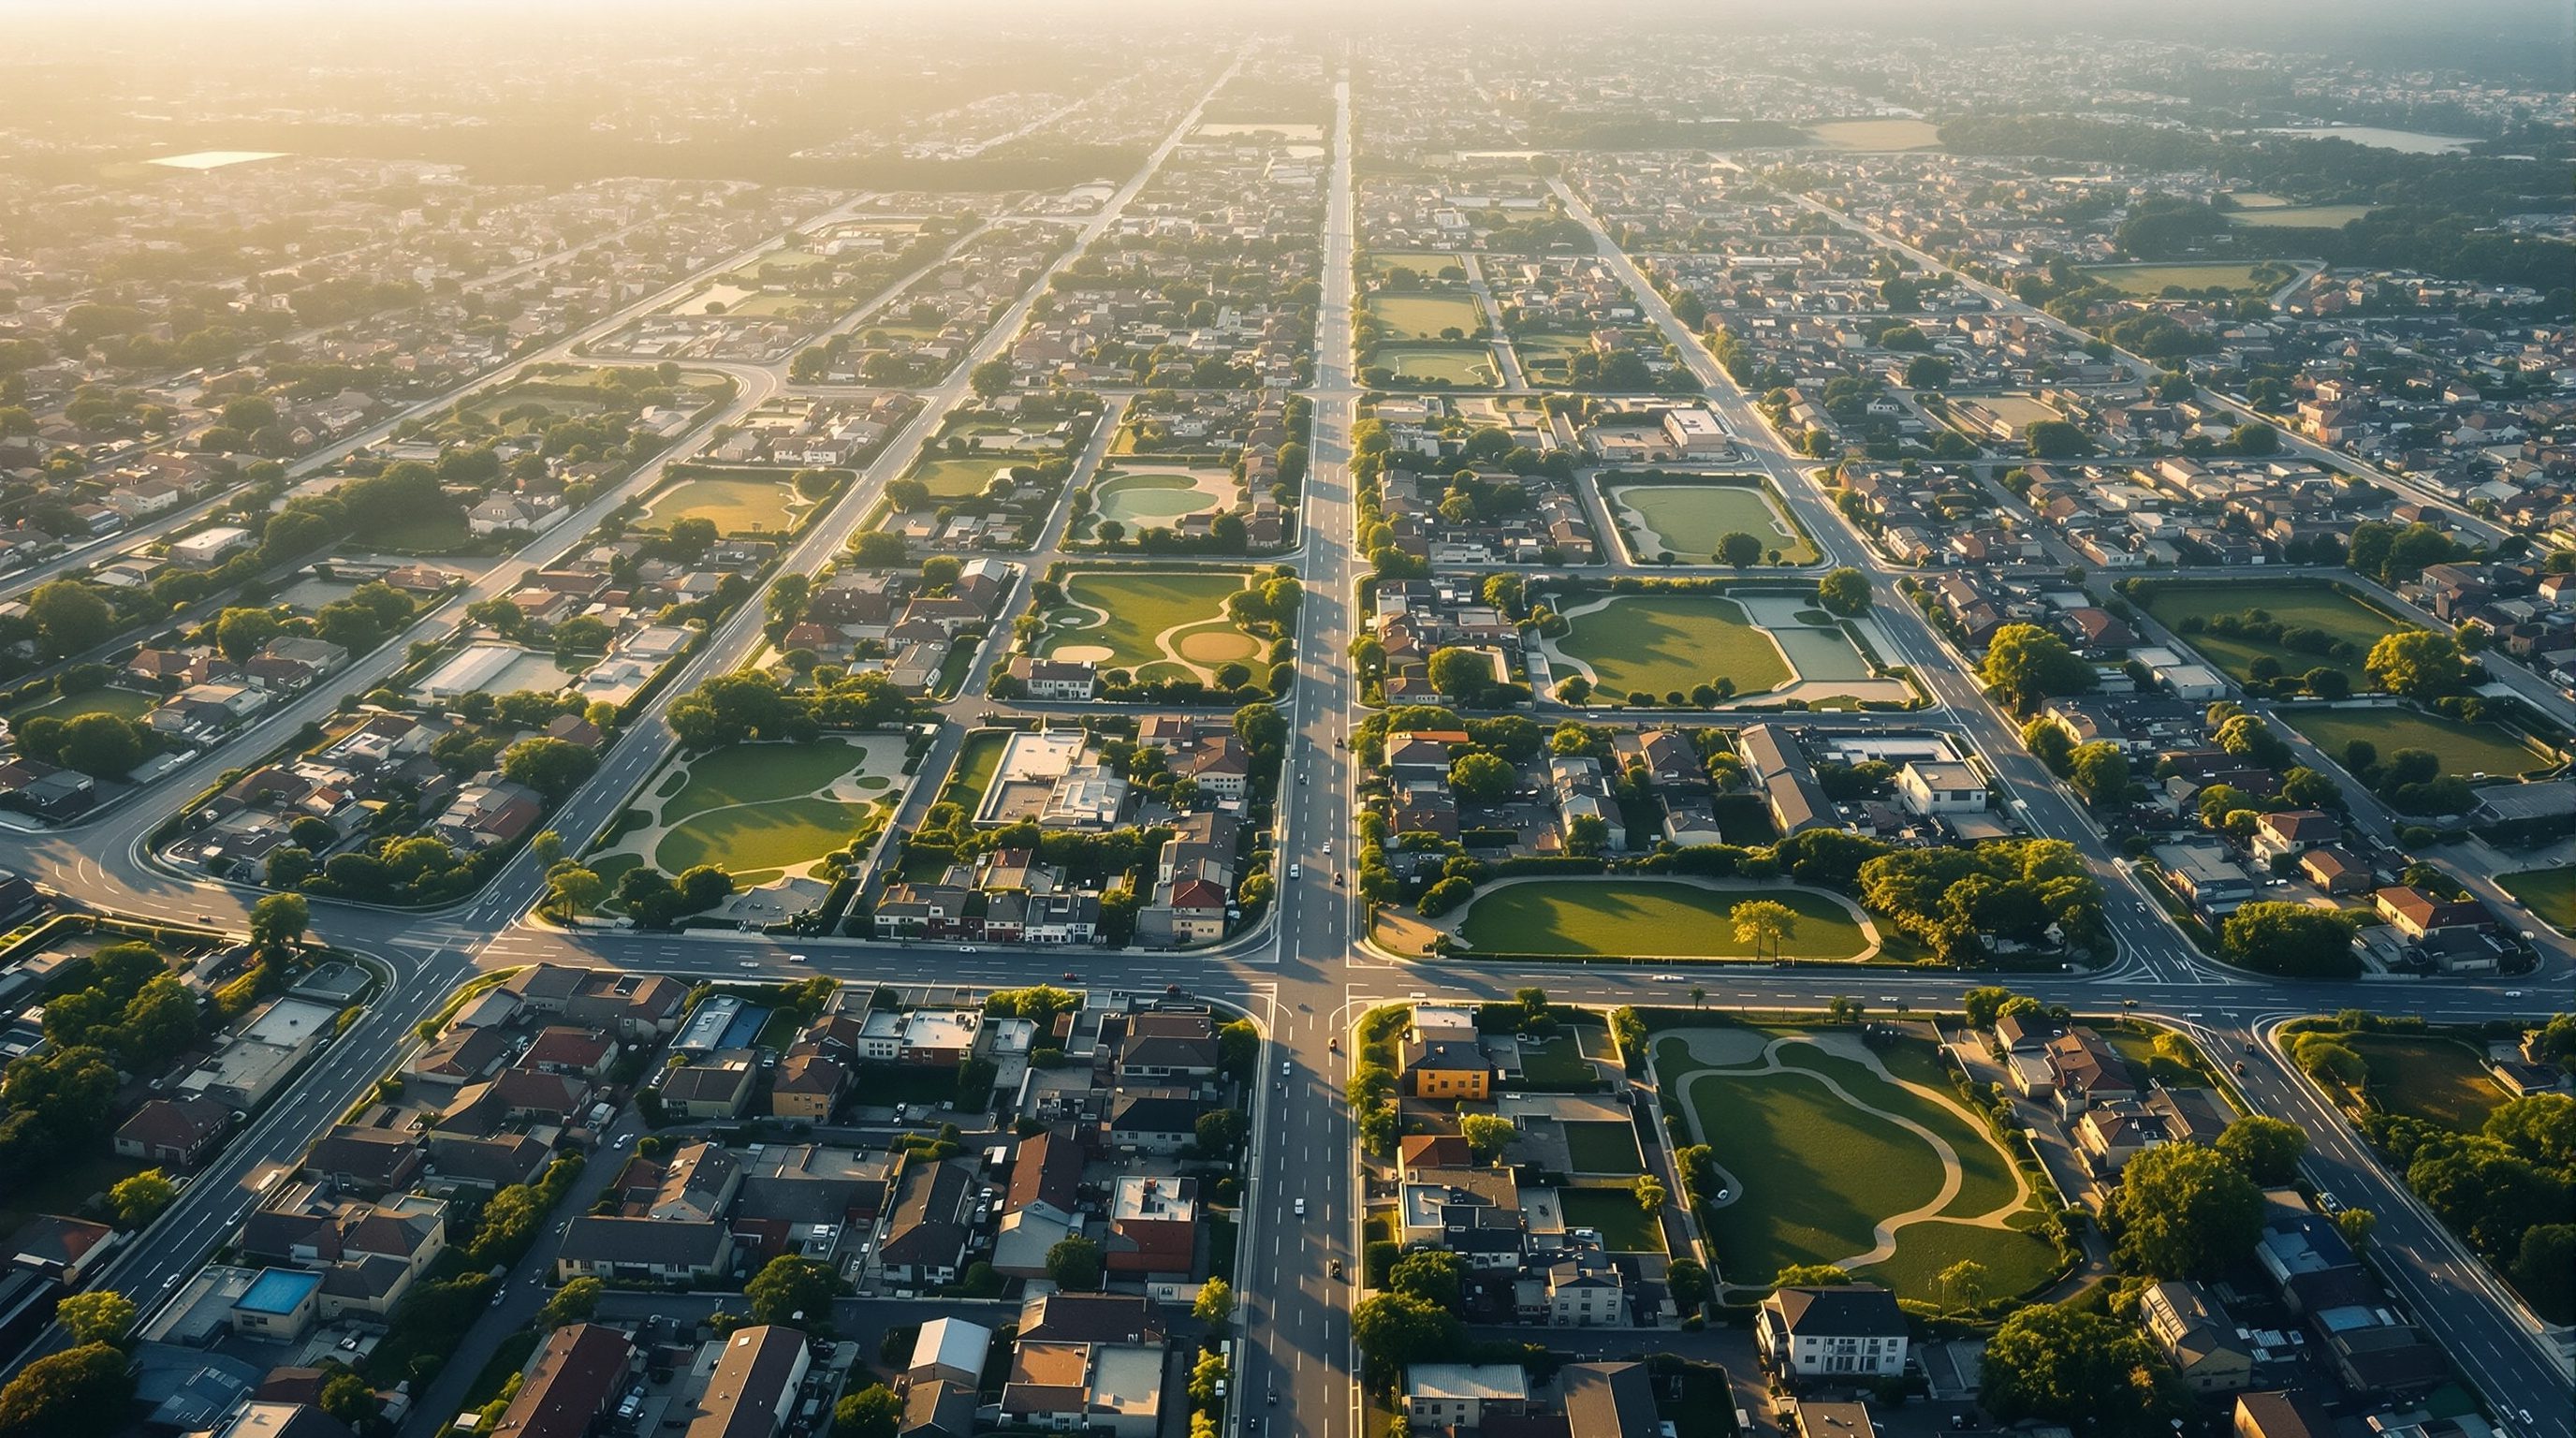
 Lesson 0.1
Lesson 0.1 · Ground Rules — Thinking Spatially
What GIS Is (and Isn't) for Designers
The map is the least interesting thing a GIS makes
Two studios open the same site. One draws it. One asks it questions.
Both teams have the same plot in the same city. The first traces the boundary, the contours and the road, and produces a beautiful drawing. The second loads the same plot into a GIS and, within an hour, knows the plot's slope, how far it sits from the nearest bus stop, which way the monsoon-facing slope drains, how many households live within a five-minute walk, and whether any of it floods. The drawing shows you the site. The GIS lets you interrogate it. That difference is the whole course.
The best GIS insight often never becomes a map — it becomes a better decision.
GIS is location plus information, joined so you can ask questions
A Geographic Information System is exactly what its three words say, read backwards. It is a system — software, data and methods working together. It holds information — not just shapes, but facts: names, populations, heights, land uses, dates. And every piece of that information is tied to a geographic location on the Earth's surface.
That last join is the magic. In a normal spreadsheet you have a row for a ward and a column for its population. In a GIS, that same row is also a shape on the map — the ward's actual boundary. Because the two are joined, you can ask questions that neither the table nor the drawing could answer alone: which wards with over 20,000 people have no park within 500 metres? The system selects them, colours them, and counts them for you. A drawing cannot do that. A spreadsheet cannot do that. A GIS does it because it knows both what and where.
A drawing answers “what does it look like?” A GIS answers “where, how many, and why there?”
The layer cake: how a GIS holds the world
Open any GIS project and you are looking at a stack of transparent sheets, one on top of the other. The bottom sheet might be a satellite image. Above it, a sheet of roads. Above that, plot boundaries. Above that, buildings. Above that, trees. Each sheet is a layer, and each layer holds one kind of thing together with its data.
The power of layers is that you can turn them on and off, reorder them, and — crucially — analyse across them. Lay the flood-zone layer over the plots layer and the GIS will tell you which plots are at risk. Lay the bus-stop layer over the population layer and it will tell you who is under-served. You are no longer looking at a map; you are looking at a model of the place that you can take apart and recombine to answer whatever your design needs to know.
What GIS is NOT
It is not a drawing program. AutoCAD, Illustrator and SketchUp are wonderful for making things; they know geometry but not the ground. A CAD line does not know it is in Bengaluru, does not know its length in real metres on a curved Earth, and carries no attached facts. A GIS feature does. (Module 1 gives interoperability its own lesson — CAD, GIS and BIM each have a job.)
It is not just “making maps,” either. A finished map is one output of a GIS, and often the least interesting one. The real work is the analysis behind it. And it is not a single app you buy: it is a discipline you can practise in free software (QGIS) or paid software (ArcGIS Pro), on the desktop or in a browser. The skill travels; the tool is a detail.
If it can’t answer a “where” question, it’s a picture of a map, not a GIS.
Why a designer should care
Design is a series of where decisions. Where does the building sit on the plot? Where do people arrive from? Where does water go? Where is the noise, the sun, the view, the crowd? For a hundred years we answered these by walking the site and trusting our eyes — and we still should. But the eye sees one plot on one day. A GIS lets you see the plot in the context of its whole neighbourhood, across seasons, against real data on who lives there and how they move.
In India this matters twice over, because so much design happens fast, at scale, and under statutory plans (master plans, development plans) that are themselves becoming GIS. An architect who can read and query those datasets argues from evidence, not assertion — with the client, and with the authority.
ISRO Bhuvan
India's national geoportal (satellite imagery + thematic layers)
Free with registration; your first place to see “the layer cake” for any Indian location. bhuvan.nrsc.gov.in
OpenStreetMap (OSM)
Global community vector map — roads, buildings, land use
Free under the ODbL (attribution + share-alike). The fastest way to get context layers anywhere.
National Geospatial Policy 2022
India's policy framework for the geospatial ecosystem
Notified by the Ministry of Science & Technology; signals that public planning data is moving to open, GIS-ready form.
Workshop — see the layer cake for your own city
No analysis yet — just prove to yourself that a place is a stack of queryable layers. You will open a free GIS, add a base map, and drop in one real data layer for an Indian city of your choice.
QGIS 3.44 (free) with QuickOSM, or a free ArcGIS Online account; internet connection.
Goal: a QGIS (or ArcGIS Online) project showing a satellite base map + one OpenStreetMap layer for your city
Data: OSM (free) + Bhuvan/Esri imagery base
Time: ~30 minutes
- 1Install and open QGIS (free, qgis.org, LTR 3.44). In ArcGIS: sign in to ArcGIS Online and open Map Viewer instead — the concepts are identical.
- 2Add a satellite base map. In QGIS: Browser panel → XYZ Tiles → add an imagery tile source, or use the QuickMapServices plugin. In ArcGIS Online: Basemap → Imagery.
- 3Add a real vector layer. In QGIS: install the QuickOSM plugin, run a quick query for
amenity=hospital(orhighway) in your city, and watch points/lines appear over the imagery. In ArcGIS Online: add a layer from ArcGIS Living Atlas. - 4Toggle the layer on and off, and drag it above and below the base map. Notice that it is a separate sheet you control.
- 5Click one feature with the Identify tool (QGIS: Identify Features; ArcGIS: click the feature). Read its attributes. That table is the information in “Geographic Information System.”
You’ll walk away with
A two-layer map of your city and the realisation, in your own hands, that a GIS is a controllable stack of location-plus-information — not a drawing.
Three altitudes on the same idea
Read the band that fits you — or all three.
GIS is your site-analysis multiplier. Before you sketch a single line, it can tell you the plot's slope and aspect, its distance to transit and amenities, its flood and noise exposure, and its context fabric — the evidence that makes a concept defensible. You will not model beams in it; you will decide where and why in it, then hand geometry to CAD/BIM.
GIS is the substrate of modern statutory planning. Master plans, development plans and CDPs in India are shifting to GIS base maps (the AMRUT and NUIS programmes exist precisely for this). Learning to load, query and overlay land-use, population and infrastructure layers is learning the medium your profession now works in — the difference between reading a plan and building one.
GIS turns “this street feels wrong” into a measurable claim. Walkable catchments, block sizes, junction density, who lives within a five-minute walk of what — these are the raw material of urban design, and they are all where questions. GIS lets you test a public-realm idea against the real distribution of people and destinations before you commit a rupee.
“GIS is just software for making nicer maps.”
Do it yourself
No software needed — just think like a GIS for five minutes.
- 1Write down three “where” questions about a site you know well (e.g. “where does it flood?”). These are the questions a GIS answers.
- 2For each question, name the one layer you would need to answer it (flood zones, contours, bus stops…).
- 3Pick any paper map you own and ask: what facts are hidden in it that a GIS version could let me count or select?
- 4Look up your city on Bhuvan (bhuvan.nrsc.gov.in) and list the thematic layers it offers.
The one line to carry out
Peer-reviewed journals & authoritative standards
- 01Longley, P.A., Goodchild, M.F., Maguire, D.J. & Rhind, D.W. — Geographic Information Science and Systems, 4th ed. — Wiley, 2015.
- 02Bolstad, P. & Manson, S. — GIS Fundamentals: A First Text on Geographic Information Systems, 7th ed. — Eider Press, 2022.
- 03Bhuvan — Indian Geoportal of ISRO — ISRO / NRSC, ongoing.
If a GIS holds the world as layers, we need to know exactly how each layer stores reality — as sharp shapes, or as a grid of values. That is the vector-versus-raster distinction, and it is next.
The author
Amogh N P
Architect, interior designer, and creative polymath. Studio Matrx began in his notebooks — his vision of design made honest, useful, and open to everyone. Its Academy is written and taught in his memory, and free, forever.
More about Amogh →