
 Lesson 2.2
Lesson 2.2 · Acquiring Spatial Data
Satellite Imagery Sources
Where the pictures from orbit come from, and what each can see
The same city, seen at 30 metres, 10 metres, and half a metre. Three different truths.
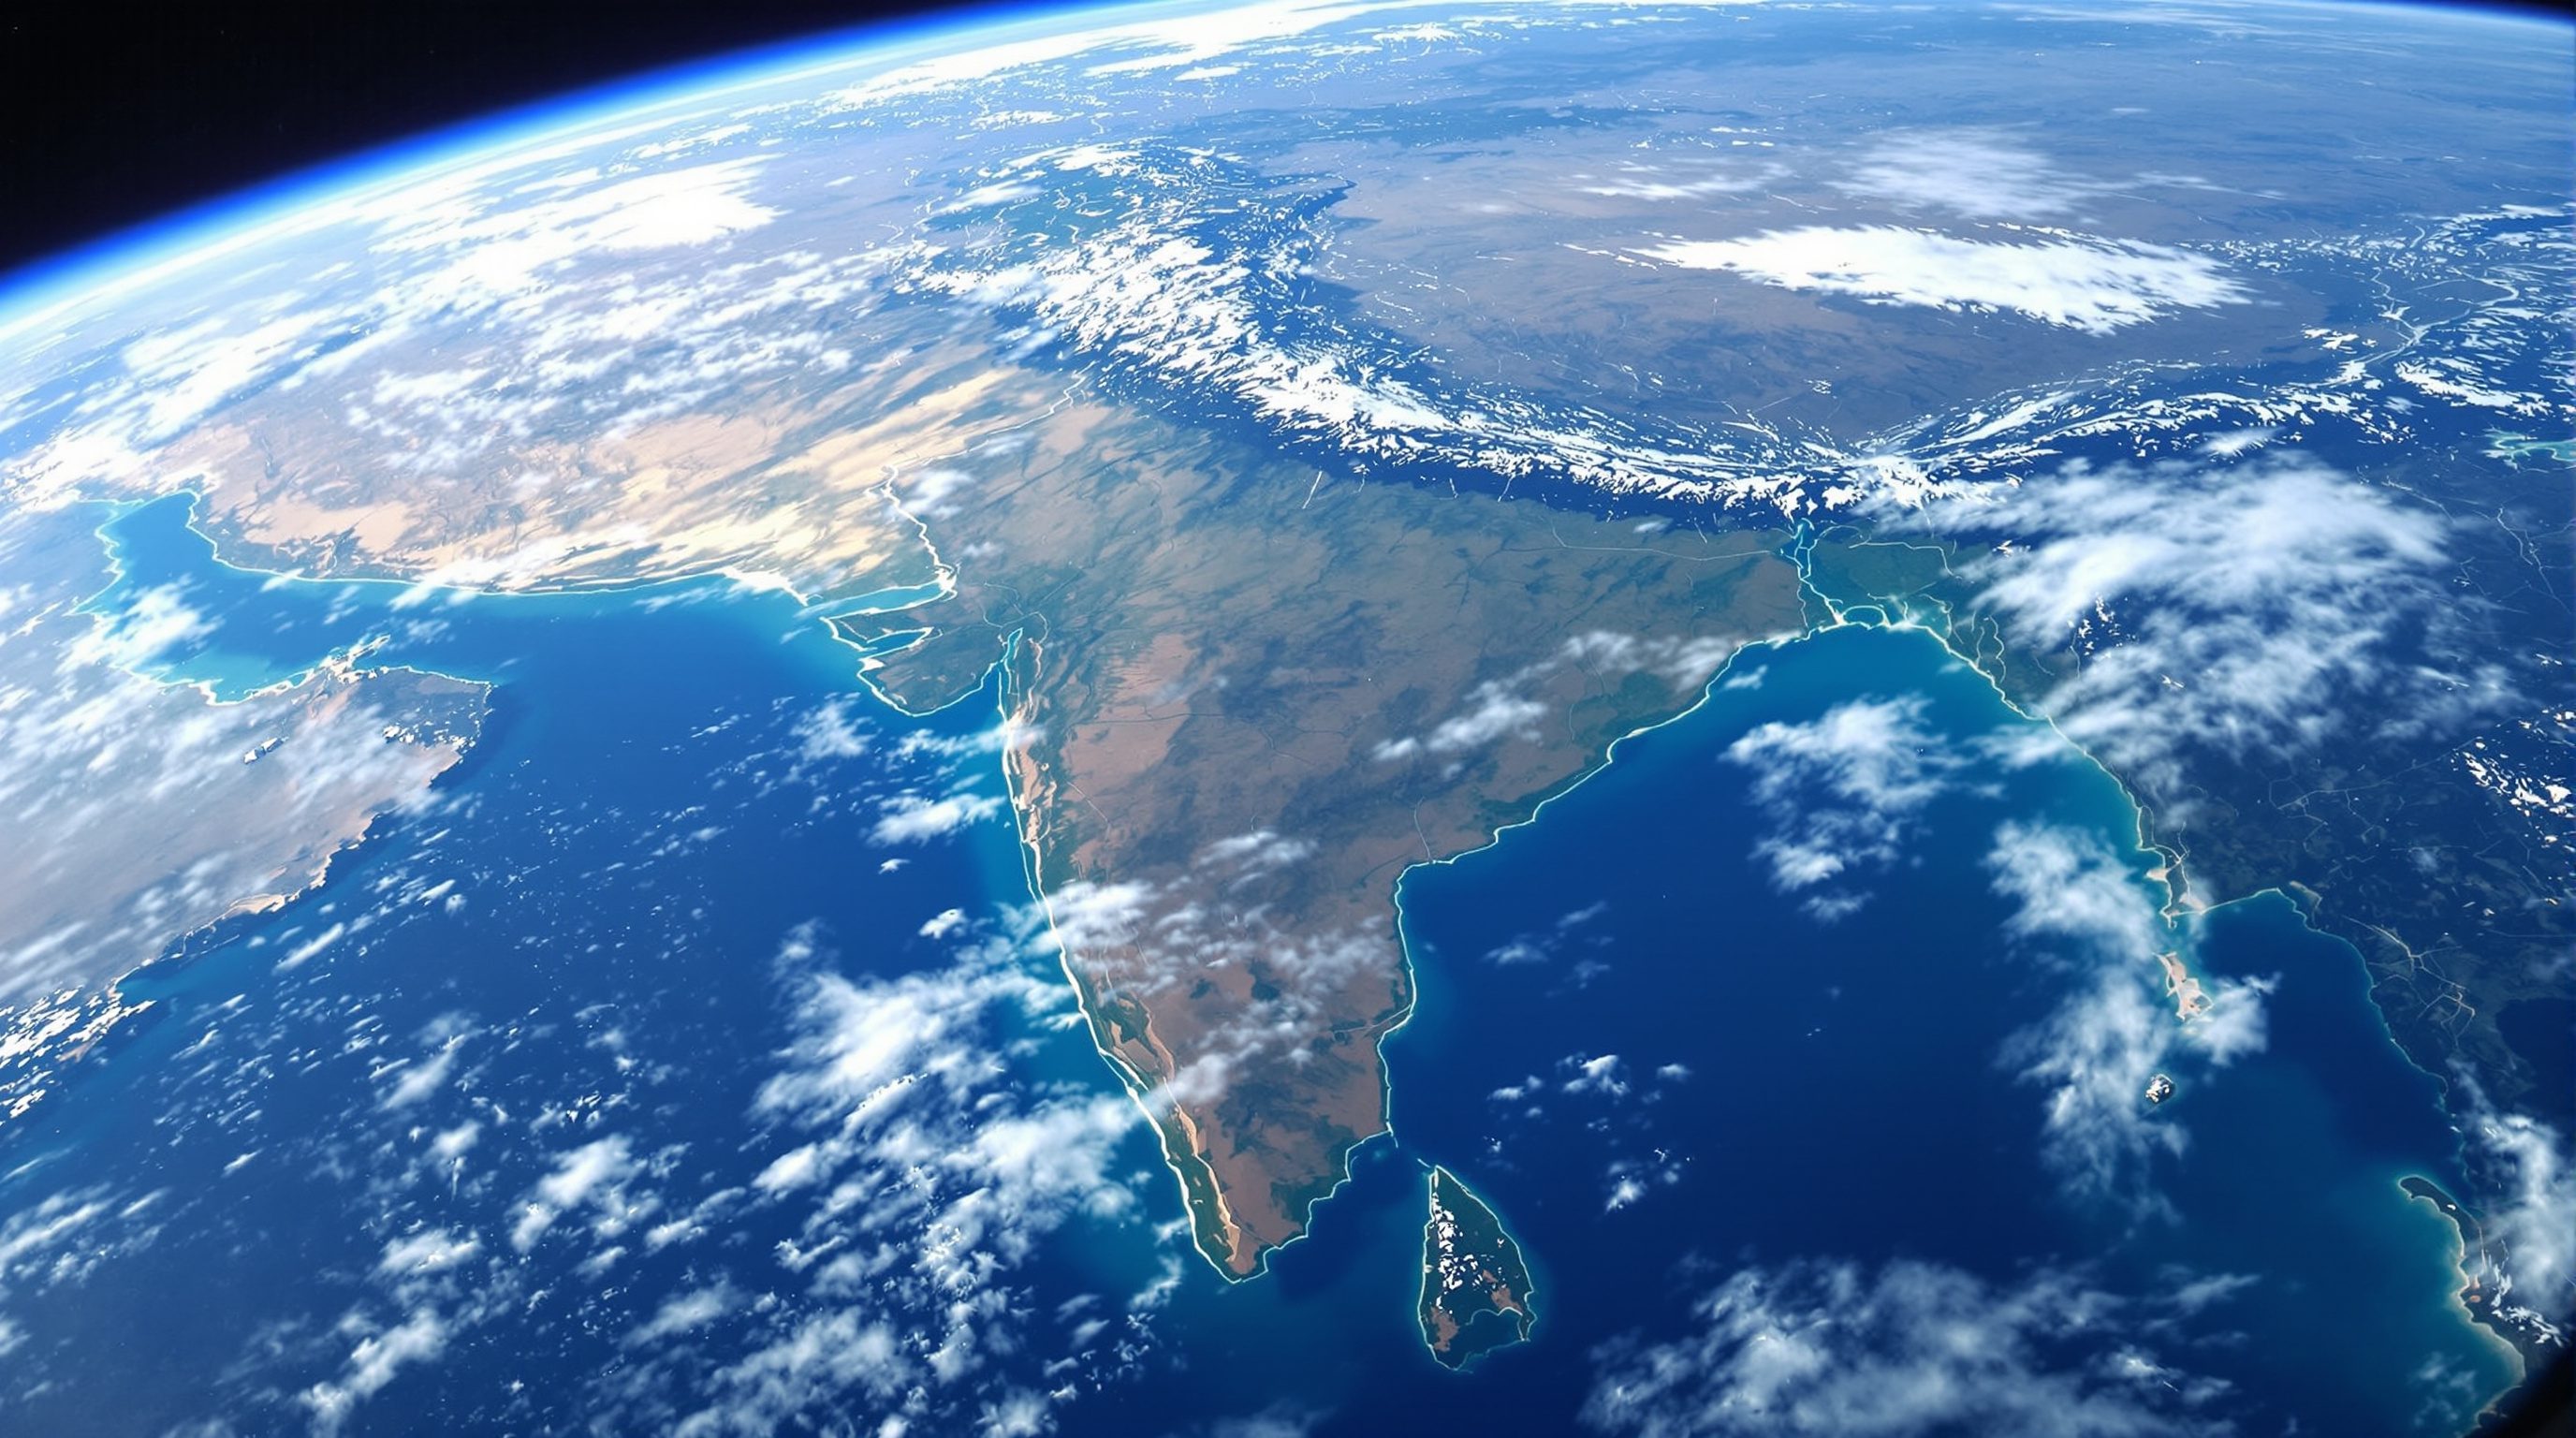
You need to know how a district has grown, whether a lake has shrunk, how much green cover a ward really has. You cannot walk all of it, and you should not guess. Satellite imagery gives you a repeatable, dated, measurable picture from orbit - much of it free. But every sensor sees the world at a particular grain, in particular colours, on a particular rhythm. Ask Landsat to find a footpath and it cannot; ask Sentinel-2 to map land cover across a whole taluk and it excels. The skill is matching the sensor to the question - and being honest that in India the sharpest imagery is not the free imagery.
Imagery is a measurement, not a photo. It has a date, a sensor, and an error bar.
The four resolutions that decide what a sensor is good for
Every satellite sensor is described by four kinds of resolution, and confusing them causes most beginner mistakes.
Spatial resolution is the ground size of one pixel - 30 m for Landsat, 10 m for Sentinel-2. It sets the smallest thing you can see. Spectral resolution is how many, and how narrow, the colour bands are - not just red, green and blue but near-infrared and shortwave-infrared, which is how you measure vegetation and water. Temporal resolution (revisit) is how often the satellite returns to the same place - days for the free workhorses, so you can track change. Radiometric resolution is how finely each pixel records brightness. For built-environment work the first three decide almost everything: how small, in what colours, how often.
You cannot zoom your way to detail that was never captured. Resolution is baked in at the sensor.
Landsat: the 30 m half-century archive, free from USGS
The Landsat programme (NASA and USGS) has imaged the Earth since 1972, which makes it the go-to record for long-term change. Current Landsat 8 and 9 deliver multispectral imagery at about 30 m (with a 15 m panchromatic band for sharpening), and you download it free from USGS EarthExplorer, in the public domain.
Thirty metres sounds coarse, and for a single plot it is. But its value is the archive: because you can pull comparable scenes from the 1980s to today, Landsat is unmatched for tracking how a city has sprawled, how a wetland has contracted, or how green cover has changed over decades. When the question is how has this changed over a long time, Landsat is usually the honest first answer.
Sentinel-2: the 10 m free workhorse from Copernicus
The European Union's Copernicus programme runs Sentinel-2, a pair of satellites delivering optical imagery at 10, 20 and 60 m depending on the band, with a revisit of only a few days. You download it free and openly from the Copernicus Data Space Ecosystem. For most built-environment analysis on a budget, Sentinel-2 is the default: 10 m is fine enough to read neighbourhoods, land use, water bodies and vegetation, and the frequent revisit means you can almost always find a recent cloud-free scene.
The partner Sentinel-1 carries radar (SAR) rather than an optical camera, so it sees through cloud and at night - invaluable in the monsoon, when optical sensors are blinded for weeks. Together the Sentinels are the free imagery backbone of serious Indian GIS work.
In monsoon, optical is blind for weeks. That is when radar (Sentinel-1) earns its keep.
India's own eyes: Cartosat, Resourcesat and Bhoonidhi
India flies its own Earth-observation fleet through ISRO, and you reach it through the National Remote Sensing Centre (NRSC) - the Bhoonidhi ordering portal, with many layers also viewable on Bhuvan. Two families matter here. Resourcesat carries the LISS-III sensor at about 23.5 m and AWiFS at about 56 m - medium-resolution multispectral imagery for land and vegetation, some of it free. Cartosat is the high-resolution optical family, from sub-metre to a few metres, used for detailed mapping.
Here is the honest India caveat this course insists on: the finest ISRO imagery is not free to the public. High-resolution Cartosat data is priced under the NRSC/ISRO data policy, and the exact per-scene cost varies by sensor and licensee (we do not quote a figure because it is not publicly fixed). So the practical Indian stack is: free Sentinel-2 and Landsat for most work, free Resourcesat/AWiFS where it helps, and priced Cartosat only when a task genuinely needs sub-metre detail and the budget exists.
Matching the sensor to the question
Put the pieces together as a decision, not a habit. Long-term change over a large area - Landsat, for the archive. Current land use, vegetation and water at neighbourhood scale, on any budget - Sentinel-2, for the 10 m and the frequent revisit. Cloud-blind monsoon monitoring - Sentinel-1 radar. India-specific medium-resolution products, or an official Indian source - Resourcesat via Bhoonidhi. Genuine building-scale detail - priced Cartosat, or commercial very-high-resolution imagery, budget permitting.
And always record the scene's date and sensor on your map. Imagery is a measurement taken at an instant; a land-cover map from a February scene and one from a July scene can disagree completely, and the reader deserves to know which day you are showing them.
USGS EarthExplorer (Landsat 8/9)
Free ~30 m multispectral imagery, global, long archive since 1972
Public domain, free with registration; the definitive source for long-term change. earthexplorer.usgs.gov
Copernicus Data Space (Sentinel-2)
Free 10/20/60 m optical imagery, global, few-day revisit
Copernicus full, free and open data; the default free workhorse for the built environment. dataspace.copernicus.eu
ISRO Bhoonidhi / NRSC (Cartosat, Resourcesat)
India's EO archive: LISS-III ~23.5 m, AWiFS ~56 m; Cartosat sub-metre to few-metre
Mix of free and priced per NRSC/ISRO data policy; high-resolution Cartosat is not free to the public. bhoonidhi.nrsc.gov.in
OGC WCS
Web Coverage Service - global standard for serving raster/coverage data
How imagery and elevation are delivered as analysable values (not just pictures) to QGIS and ArcGIS over the web.
National Geospatial Policy 2022
India's policy framework for the geospatial ecosystem
Signals the direction of open access to Indian EO and map data; the backdrop to what NRSC releases free versus priced.
Workshop — download and compare Landsat and Sentinel-2
You will pull one Landsat scene and one Sentinel-2 scene for the same city, and see the 30 m versus 10 m difference with your own eyes - plus locate the Indian source you would order Resourcesat from.
QGIS 3.44 (SCP plugin optional) or ArcGIS Pro; free USGS EarthExplorer and Copernicus Data Space accounts.
Goal: a project comparing a 30 m Landsat scene and a 10 m Sentinel-2 scene of one Indian city
Data: Landsat 8/9 (free, USGS) + Sentinel-2 (free, Copernicus)
Time: ~60 minutes
- 1Register at earthexplorer.usgs.gov, draw a search area over your city, filter to Landsat 8-9 OLI/TIRS, pick a recent low-cloud scene and download it.
- 2Register at dataspace.copernicus.eu, search Sentinel-2 for the same area and a similar date, and download a low-cloud tile.
- 3In QGIS: add both, then build a natural-colour composite for each (Symbology to Multiband color, or use a plugin such as the Semi-Automatic Classification Plugin to stack bands). In ArcGIS Pro: add the rasters and set the band combination in the Symbology pane.
- 4Zoom to the same neighbourhood in both. Note what the 10 m Sentinel-2 resolves that the 30 m Landsat blurs - a decision you now understand by resolution, not luck.
- 5Open bhoonidhi.nrsc.gov.in and locate Resourcesat LISS-III for your area; note in your project which layers are free and that high-resolution Cartosat would be priced. Record each scene's sensor and acquisition date.
You’ll walk away with
A side-by-side Landsat/Sentinel-2 comparison of one city, dated and sensor-labelled, and a clear sense of which free source answers which question - plus where India's priced high-resolution data lives.
Three altitudes on the same idea
Read the band that fits you — or all three.
Free imagery gives you dated site context; only paid or commercial data gives you building-scale detail. Sentinel-2 at 10 m is plenty for reading a plot's surroundings, green cover and water, and for a recent backdrop to a context plan. But you cannot resolve a boundary wall or a footpath from 10 or 30 m - for that you need priced Cartosat, commercial very-high-resolution imagery, or a drone (next lesson).
Landsat and Sentinel-2 are the evidence base for growth and land-use change. The decadal Landsat archive lets you demonstrate sprawl and green-cover loss with dated, defensible imagery, while Sentinel-2 keeps a current picture across a whole planning area for free. Cite the sensor and date; a change claim is only as credible as the two scenes behind it.
Imagery reads the grain of the whole district, not the fine texture of a street. Use Sentinel-2 to map built-up spread, open space and canopy across neighbourhoods, and Landsat thermal-era archives for heat patterns. For the street-level texture that urban design lives on, pair imagery with OSM vectors and, where it matters, priced high-resolution or drone data.
“All satellite imagery is basically free now if you know where to look.”
Do it yourself
No software needed — reason like a remote-sensing analyst.
- 1For each task, name the best free sensor: tracking 30 years of urban sprawl; mapping current green cover across a taluk; monitoring a flood through monsoon cloud.
- 2Explain in one sentence why you cannot recover a footpath from 30 m Landsat data.
- 3State the honest India caveat: which ISRO imagery is free, and which is priced?
- 4Why must every imagery-derived map carry the scene's acquisition date?
- 5Name the four resolutions of a sensor and, for built-environment work, say which three usually matter most.
The one line to carry out
Peer-reviewed journals & authoritative standards
- 01Lillesand, T., Kiefer, R.W. & Chipman, J. — Remote Sensing and Image Interpretation, 7th ed. — Wiley, 2015.
- 02Jensen, J.R. — Remote Sensing of the Environment: An Earth Resource Perspective, 2nd ed. — Pearson, 2007.
- 03National Remote Sensing Centre (NRSC), ISRO — ISRO / Dept. of Space, Govt. of India, ongoing.
- 04Journal of the Indian Society of Remote Sensing — Springer (Indian Society of Remote Sensing), ongoing.
Optical imagery tells you what is on the surface; to know the shape of the ground itself - its heights and slopes - you need elevation data, and that is the next lesson.
The author
Amogh N P
Architect, interior designer, and creative polymath. Studio Matrx began in his notebooks — his vision of design made honest, useful, and open to everyone. Its Academy is written and taught in his memory, and free, forever.
More about Amogh →