
 Lesson 2.4
Lesson 2.4 · Acquiring Spatial Data
Census, Land Records & Field Survey
Who lives where, who owns what, and the data you gather yourself
The satellite shows you rooftops. It cannot tell you who lives under them, or who owns the plot.
You can map every building in a ward from imagery and still know nothing that matters for a plan: how many people live there, how old they are, whether they own or rent, where one plot ends and the next begins. That knowledge lives in three very different kinds of data - the Census for people, land records for ownership, and field survey for the ground truth you collect yourself. Each is powerful, each is guarded in its own way, and in India each comes with real access and licensing catches. This lesson is about getting them honestly and joining them to the map.
The cadastre is the honest heartbreak of Indian GIS: it exists, it is digitising, and you still cannot just download it.
Census of India: the demographic backbone
The Census of India is the decadal count of the population, and it is the richest free source of who-lives-where data in the country: population, age, sex, literacy, household amenities and more, published down to the village and ward. In a GIS you join these numbers to boundary polygons - state, district, tehsil/taluk, town, village, ward - and suddenly you can map density, dependency, deprivation and demand.
The catch is that the Census publishes tables; the matching digital boundaries are a separate problem. Official administrative boundaries exist, and community efforts have also released census-linked boundary sets - the widely used Datameet community boundaries, for example, are shared under a Creative Commons Attribution licence (CC BY 2.5 India). Whichever you use, the discipline is the same: join the demographic table to the boundary layer on a shared code, and always name your boundary vintage, because ward lines change between censuses.
Census gives you the numbers; the boundaries are sold separately. Match them on a code, cite the vintage.
The trap inside every census map: the areal unit
The moment you map a rate - people per hectare, literacy percentage - by census area, you inherit a subtle statistical trap. The same underlying reality looks different depending on how you drew the boundaries and at what level you aggregated. Merge two wards and an apparent hotspot can vanish; split them differently and one appears. This is the Modifiable Areal Unit Problem (MAUP), and it is not a curiosity - it can flip which ward looks most deprived, and therefore where investment goes.
The practical defences are honest ones. Report at the finest level your data supports, not a coarse one that hides variation. State the unit you used. Be wary of comparing rates across areas of wildly different size or population. And never let a striking choropleth map make a decision that the aggregation alone could have manufactured. Census data is indispensable; it is also easy to abuse, and a good analyst says so out loud.
Land records: DILRMP, Bhoomi and the cadastre
Where the Census tells you about people, the cadastre tells you about parcels - the legal map of who owns which piece of land, tied to the Record of Rights (RoR). India's programme to digitise and geo-reference this is the Digital India Land Records Modernization Programme (DILRMP), and Karnataka's pioneering Bhoomi system is the best-known state example. A modern goal is the ULPIN - a unique land-parcel identification number, a sort of Aadhaar for a plot - that ties a cadastral polygon to its ownership record.
Here is the honest India caveat. Cadastral access is decentralised and guarded: there is no single national open-download portal for parcel geometry. Records are held state by state, usually accessed one parcel at a time through a state revenue portal, often for a fee, and bulk geometry is generally not open. So for a plan you can often see that parcels exist and read an individual RoR, but assembling a clean, complete cadastral layer for a whole area is frequently the hardest, most manual data task in Indian GIS.
SVAMITVA: drones filling the rural gap
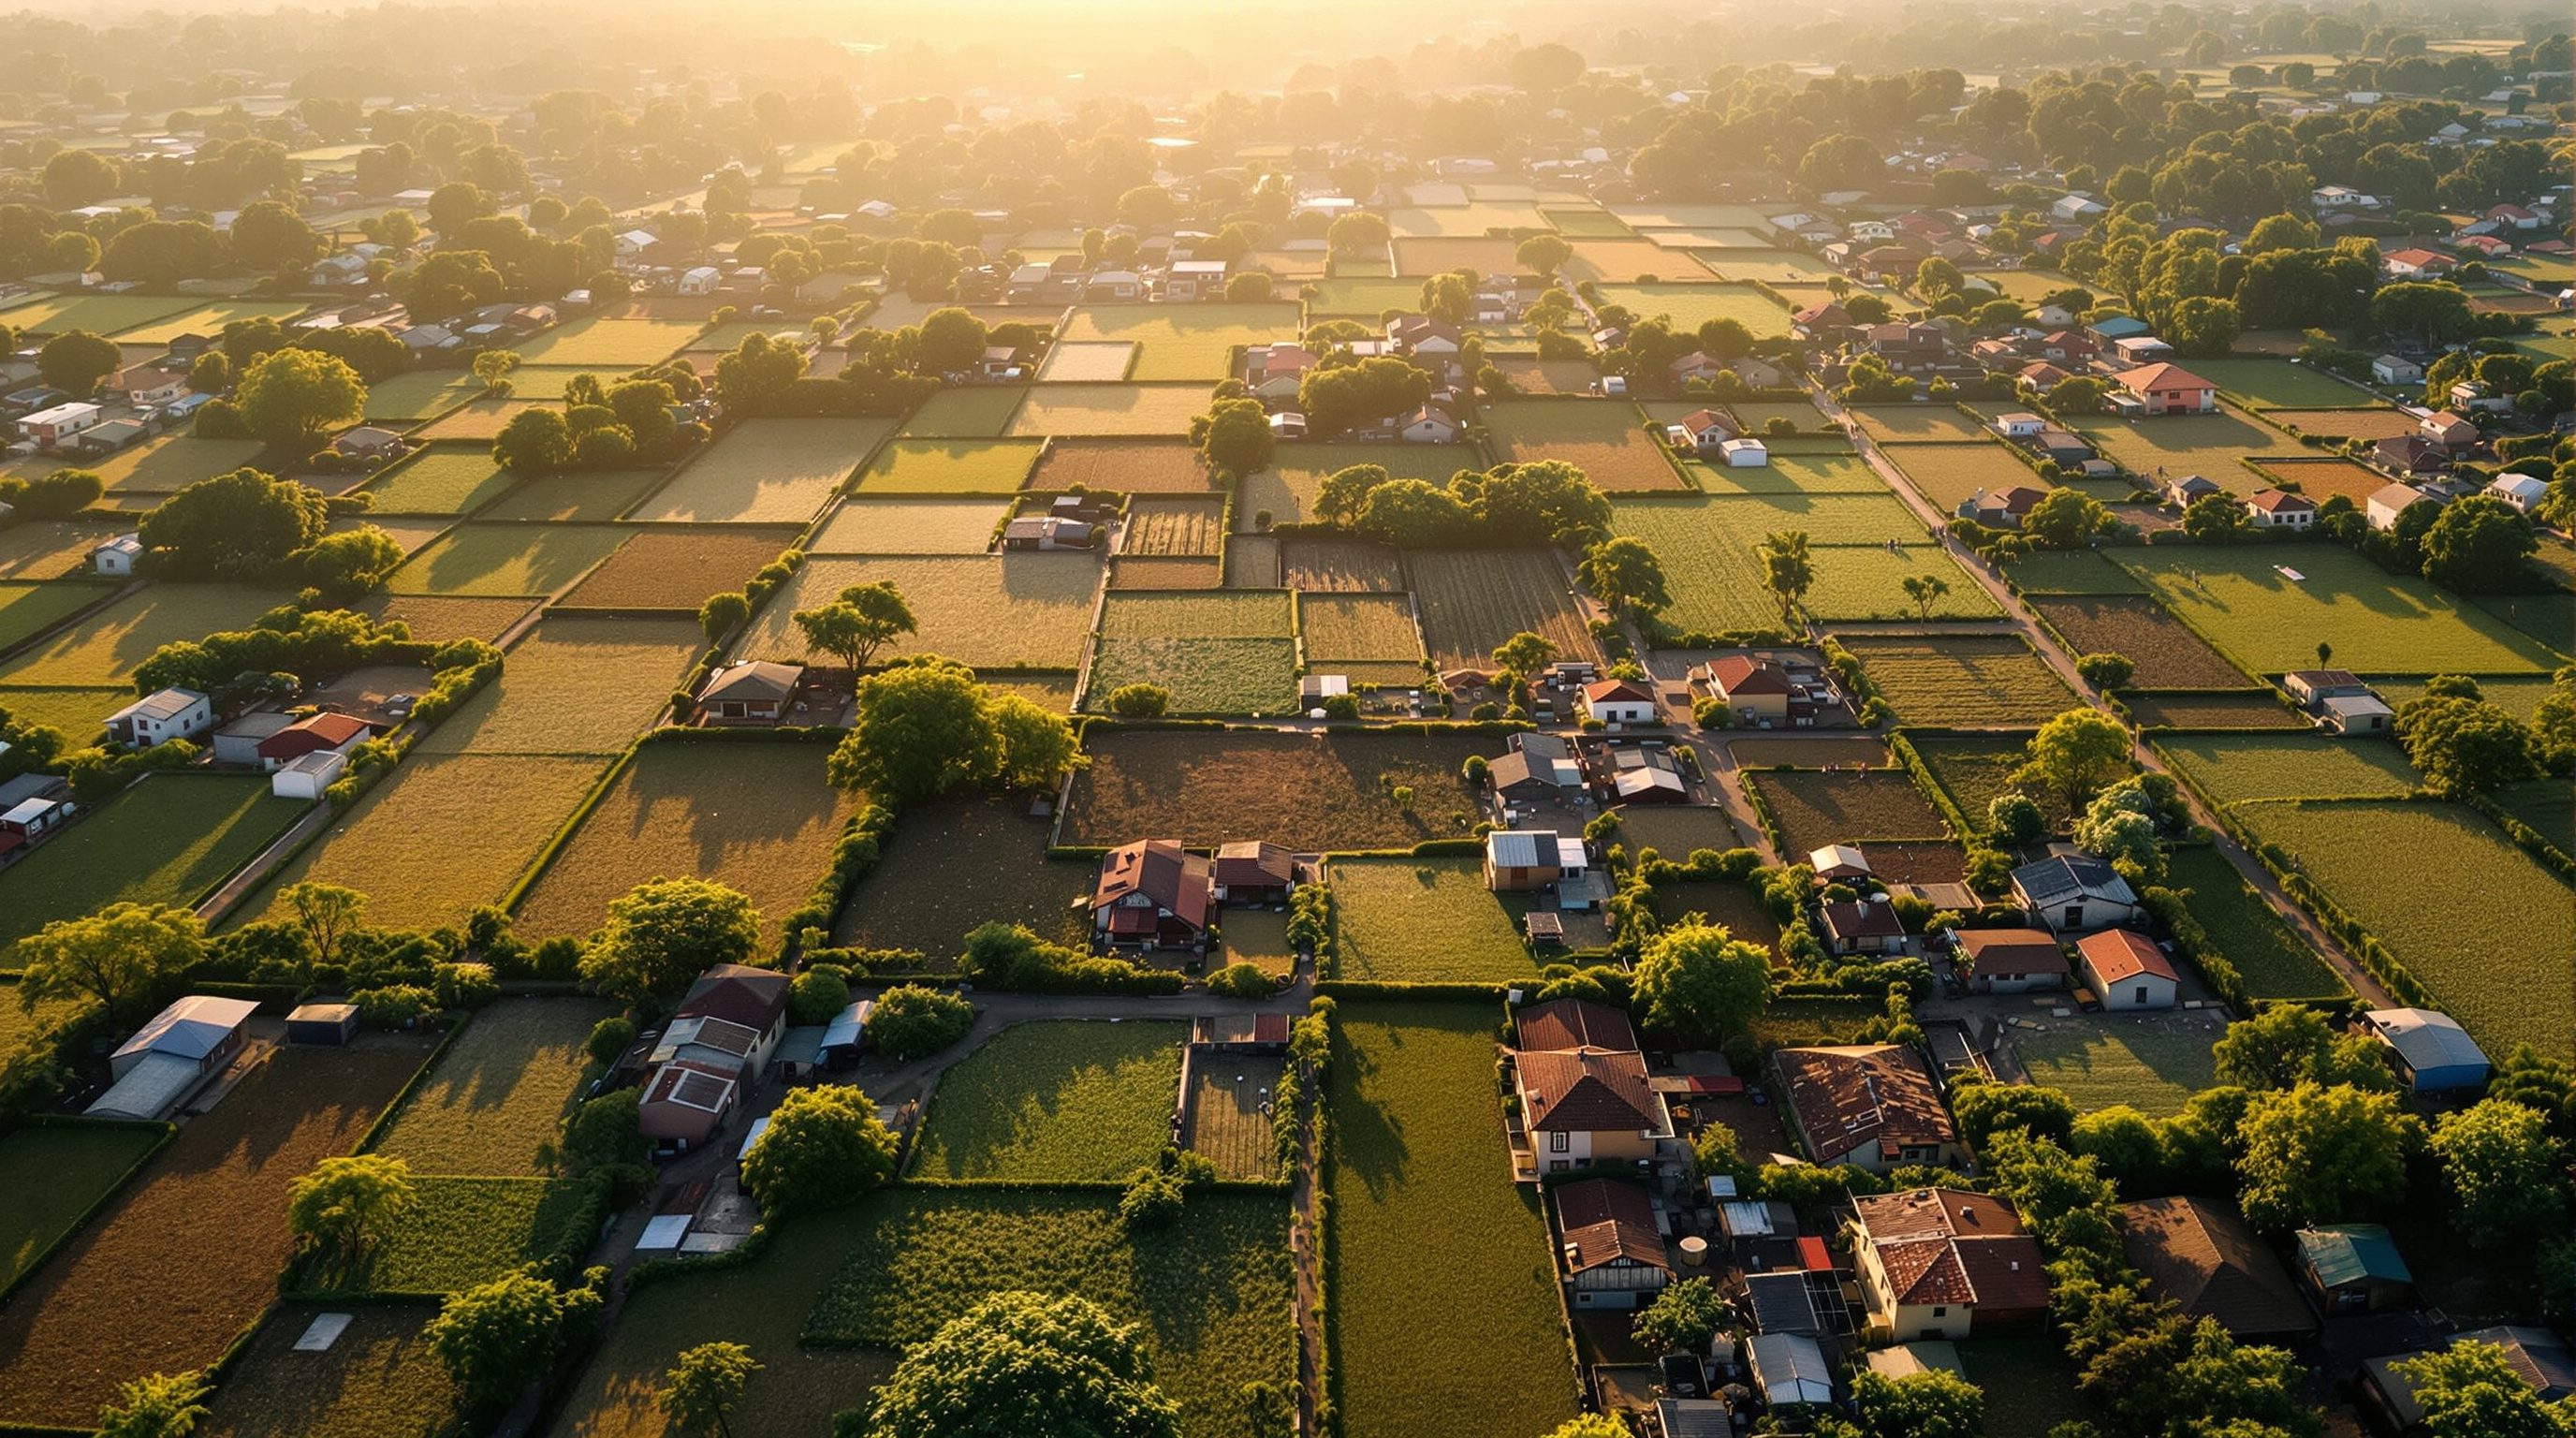
Rural inhabited land - the abadi area of a village - was historically un-surveyed at the parcel level, leaving millions of households without a formal property document. The SVAMITVA scheme (Ministry of Panchayati Raj) is closing that gap by flying drones over village abadi areas to map every rural property and issue property cards to owners.
SVAMITVA matters to this course for two reasons. First, it is creating a genuinely new cadastral layer for rural India where none existed. Second, it is the clearest official proof that drone survey has become mainstream, authoritative geospatial practice in India - not a novelty. The property cards go to owners, and the resulting spatial data feeds the wider land-records ecosystem, though access to the geometry, like the rest of the cadastre, is administered rather than openly downloadable.
Field survey: the data you gather yourself, and the licence that governs it
Sometimes no dataset exists at the grain you need, and you must collect it - field survey. At the simplest that is a smartphone or handheld GPS capturing points (a tree, a bore-well, a broken drain) with attributes typed in on site; for accuracy it is a differential GPS or total station; for area coverage it is a drone flying a grid to produce an orthophoto and a fine surface model. Field data is the only data whose accuracy and currency you fully control - and the only data you are responsible for licensing correctly when you share it.
That brings in India's data-policy layer. Public government datasets are released under the National Data Sharing and Accessibility Policy (NDSAP 2012) through the OGD platform data.gov.in, under the Government Open Data License - India (GODL-India). Your own acquisition of geospatial data and its sharing sit under the National Geospatial Policy 2022 and the 2021 DST Guidelines that liberalised geospatial data for Indian entities. The takeaways are practical: know whether a dataset is GODL-India (reusable with attribution) or restricted; and know that flying a drone and sharing the map you make from it happens within the geospatial guidelines, so read them before you publish.
Census of India
Decadal population, demographic & household data to village/ward level
Free public data as tables; join to boundary polygons on a shared code. censusindia.gov.in
DILRMP / Bhoomi
Digitised land records (RoR), geo-referenced cadastre, ULPIN; state-implemented
Accessed via state portals, usually per record and often for a fee; no single national open bulk-download for parcel geometry. dolr.gov.in
SVAMITVA
Drone survey of rural abadi property, issuing property cards
Central scheme (Ministry of Panchayati Raj) creating a new rural cadastral layer; geometry is administered, not openly downloadable. svamitva.nic.in
NDSAP 2012 / GODL-India (data.gov.in)
India's open-government-data policy and licence
Public datasets on the OGD platform are reusable with attribution under GODL-India; always check a dataset is GODL versus restricted. data.gov.in
National Geospatial Policy 2022
India's policy framework governing acquiring and sharing geospatial data
With the 2021 DST Guidelines, sets the rules under which you survey (including drones) and publish maps; read before you release field data. dst.gov.in
Workshop — map density from census joined to boundaries
You will join a census attribute table to an administrative boundary layer, map a rate honestly, and feel the Modifiable Areal Unit Problem by re-aggregating - the core move of demographic GIS.
QGIS 3.44 or ArcGIS Pro; a census table and a boundary layer (official or Datameet CC BY 2.5 IN).
Goal: a district or ward choropleth of population density from census data joined to boundaries
Data: Census of India table + admin/ward boundaries (official or Datameet CC BY)
Time: ~55 minutes
- 1Obtain a census table (population by area) from censusindia.gov.in and a matching boundary layer (official boundaries or the Datameet community set under CC BY). Note the licence of each.
- 2In QGIS: add the boundary layer, then Layer to Properties to Joins to join the census table on the shared area code. In ArcGIS Pro: use Add Join on the boundary layer's shared field.
- 3Compute density: add a field and calculate population divided by area (use an equal-area or projected CRS so area is in real units). In QGIS: Field Calculator. In ArcGIS Pro: Calculate Field.
- 4Make a choropleth: classify density and apply a graduated colour ramp. In QGIS: Symbology to Graduated. In ArcGIS Pro: Symbology to Graduated Colors. Read which areas look densest.
- 5Now feel the MAUP: dissolve pairs of adjacent units (QGIS: Dissolve; ArcGIS Pro: Dissolve) and re-map density. Watch a hotspot shift or vanish, and write one line on your map naming the unit and vintage you finally reported.
You’ll walk away with
A density choropleth built from census-on-boundaries with correct licence citation, plus a first-hand demonstration that the areal unit can change the story - and a habit of stating your unit.
Three altitudes on the same idea
Read the band that fits you — or all three.
Census gives your project human context; the cadastre gives it a legal edge; field survey gives it the truth. Use census amenity and demographic data to justify a programme, read the individual Record of Rights to confirm the plot's ownership and boundary, and rely on your own DGPS or drone survey for the site geometry you will actually build to. Never assume a free cadastral layer exists - budget for the survey.
Census plus boundaries is the analytical heart of statutory planning - handled honestly. Density, gap and equity analysis all start from census tables joined to boundary polygons, but the Modifiable Areal Unit Problem means your unit choice can steer the result. Report at the finest level available, cite the boundary vintage and licence (Datameet CC BY, GODL-India), and treat the cadastre as guarded, state-by-state data you assemble with effort.
The people data behind a street is census; the fine texture is field survey. Who lives within a five-minute walk, and how old they are, comes from census-on-boundaries. But the shopfront widths, the broken kerb, the informal stall - the grain urban design lives on - you capture yourself with a phone, a GPS or a drone, then bring back as your own authoritative layer.
“India's land records are digitised now, so I can just download the cadastre for my study area.”
Do it yourself
No software needed — think about people, parcels and provenance.
- 1Name the source you would use for each: how many people live in a ward; who owns a specific plot; the exact position of every tree on a site.
- 2State the Modifiable Areal Unit Problem in one sentence, and one defence against it.
- 3Explain why you usually cannot download a complete cadastral layer for a study area in India.
- 4What does SVAMITVA use to map rural property, and what does an owner receive?
- 5Under which licence are most datasets on data.gov.in released, and what obligation does it place on you?
The one line to carry out
Peer-reviewed journals & authoritative standards
- 01Openshaw, S. — The Modifiable Areal Unit Problem (CATMOG 38) — Geo Books, Norwich, 1984.
- 02Longley, P.A., Goodchild, M.F., Maguire, D.J. & Rhind, D.W. — Geographic Information Science and Systems, 4th ed. — Wiley, 2015.
- 03Sub-Scheme on Formulation of GIS-based Master Plans for AMRUT Cities (TCPO/MoHUA) — Press Information Bureau, Govt. of India, 2022.
- 04Chettry, V. & Surawar, M. — Urban Sprawl Assessment in Eight Mid-sized Indian Cities Using RS and GIS — Journal of the Indian Society of Remote Sensing, 2021.
You now know where spatial data comes from; Module 3 turns that raw material into a clean, aligned working dataset - starting with georeferencing a scanned map.
The author
Amogh N P
Architect, interior designer, and creative polymath. Studio Matrx began in his notebooks — his vision of design made honest, useful, and open to everyone. Its Academy is written and taught in his memory, and free, forever.
More about Amogh →