
 Lesson 9.3
Lesson 9.3 · GIS for Urban Design & Analytics
Urban Morphology & Figure-Ground at Scale
Reading a city's grain from its blocks, plots and buildings
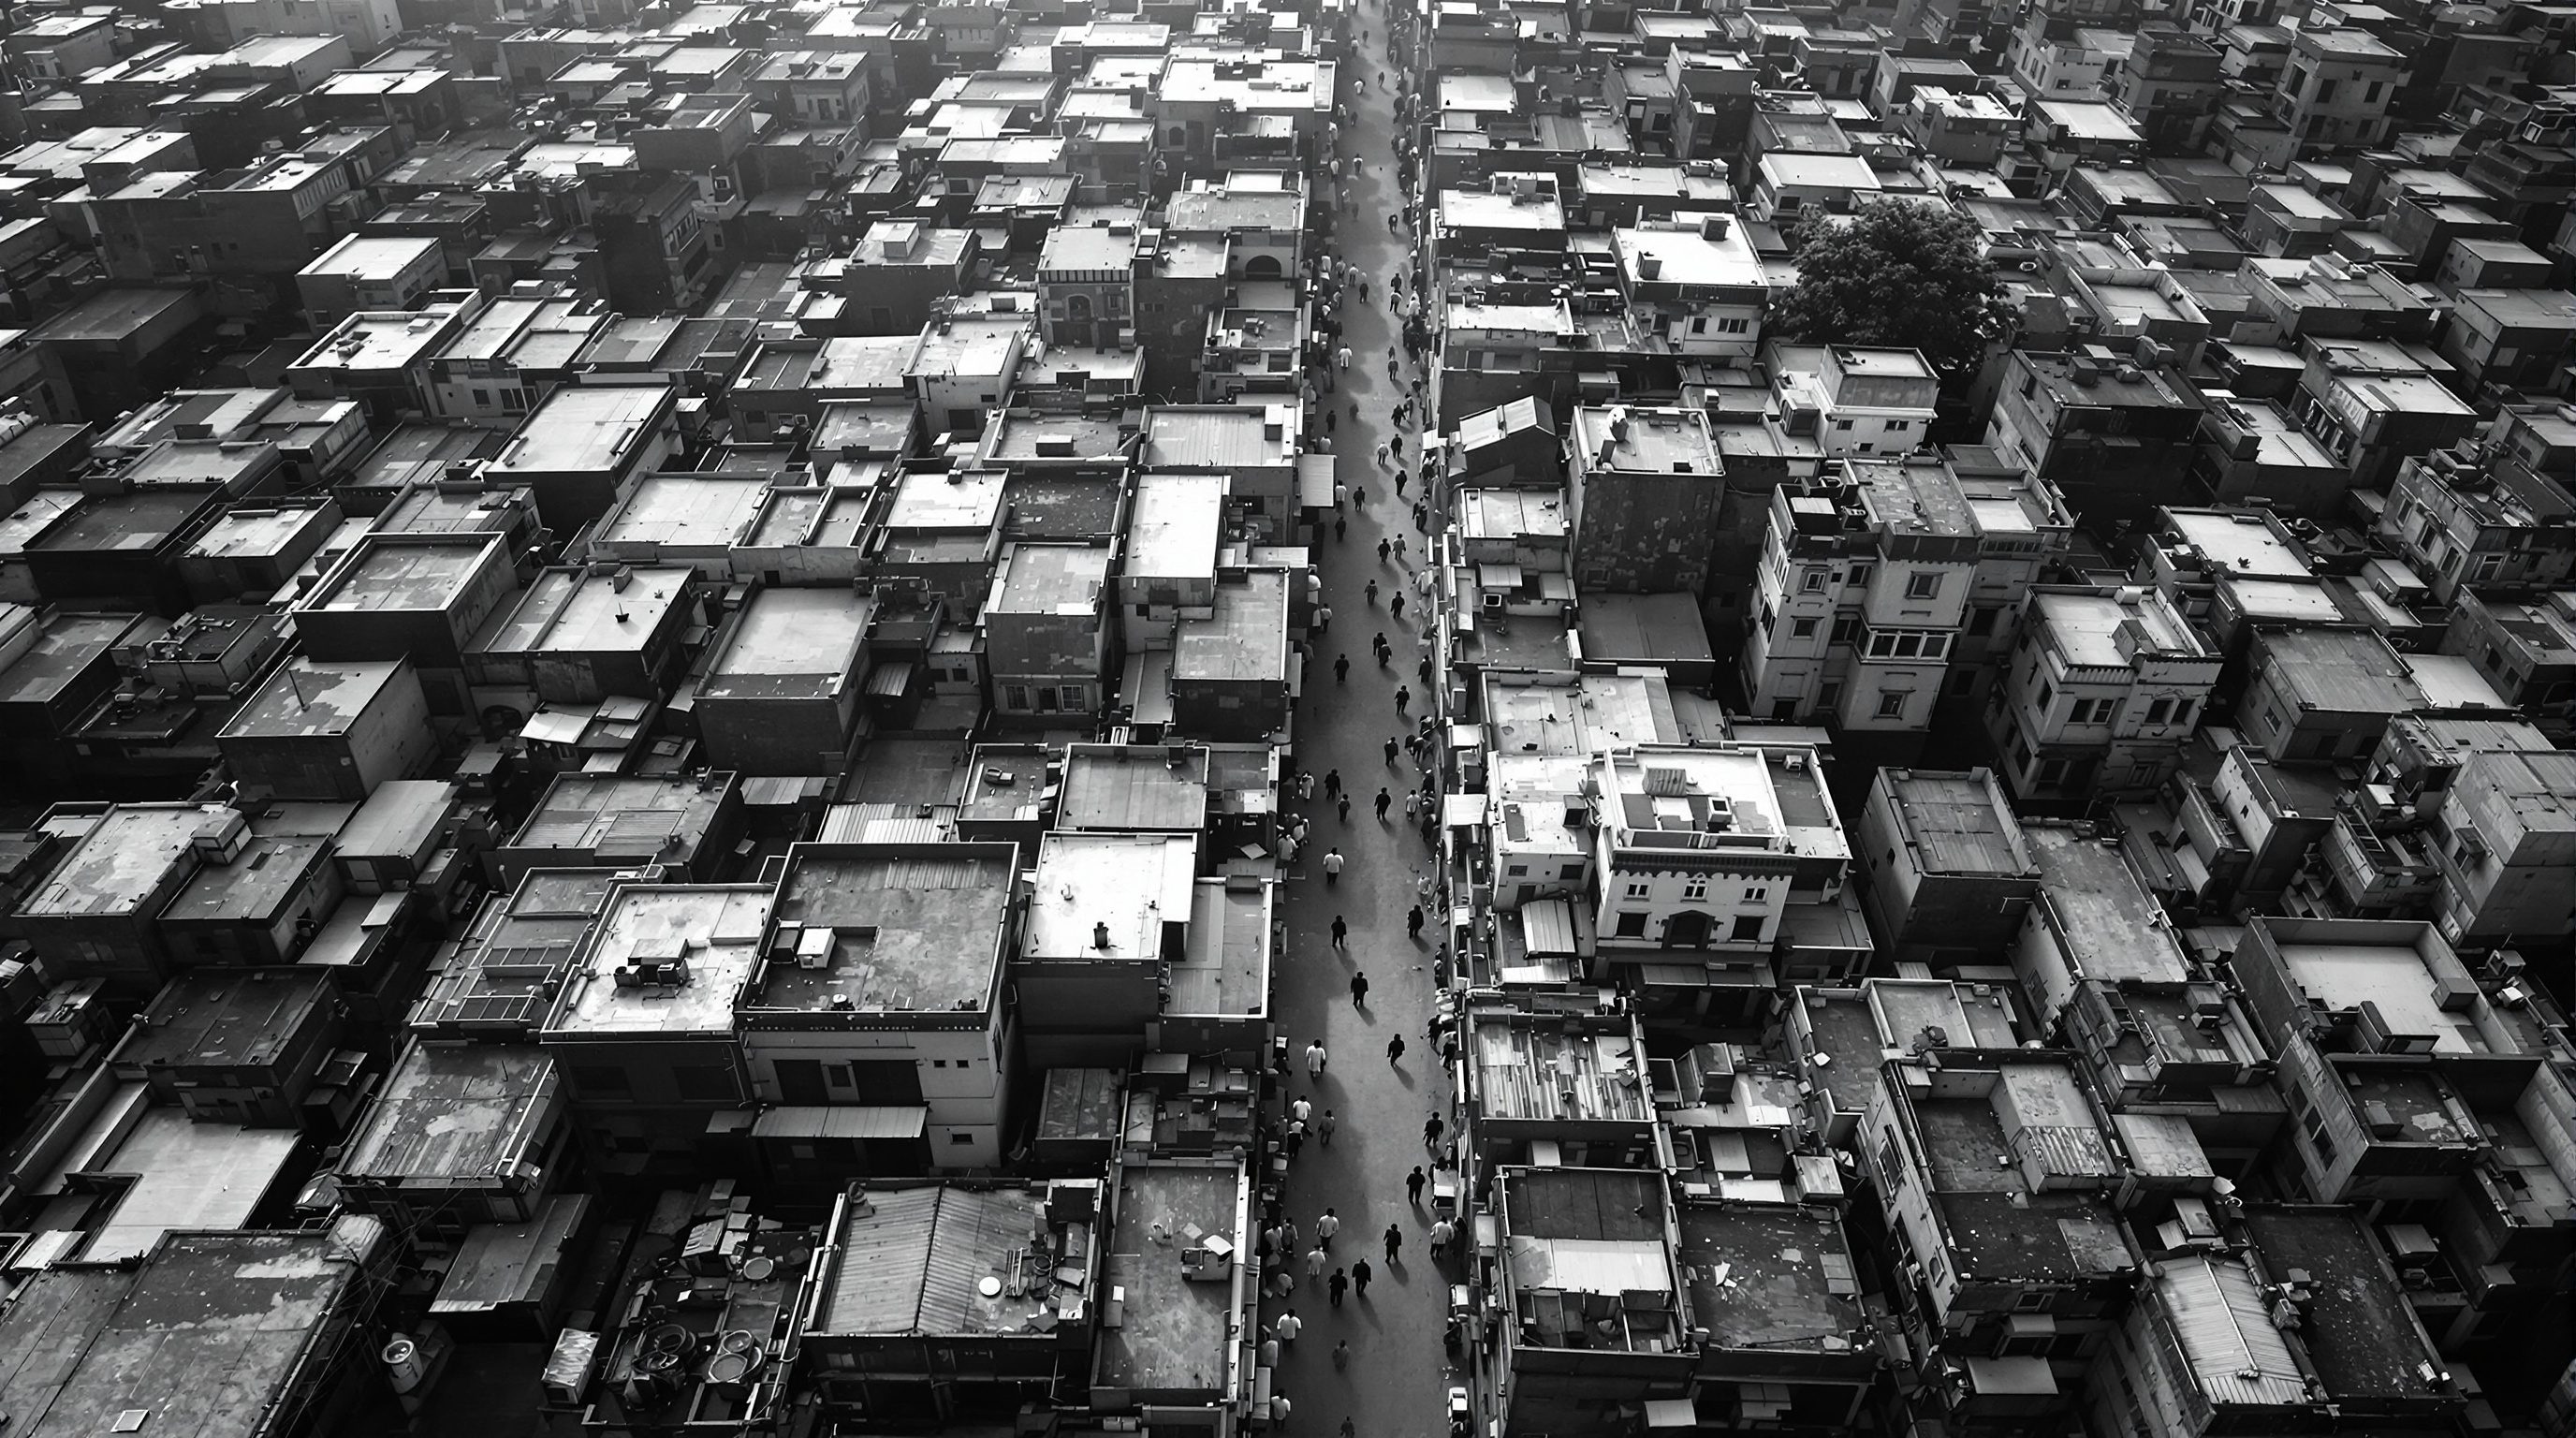
Print two neighbourhoods in black and white, buildings solid. You will not need a label to tell them apart.
A dense bazaar quarter and a gated apartment enclave produce utterly different black-and-white patterns - the first a fine, continuous mesh, the second a few fat blocks floating in tarmac. That pattern is the city's grain, and reading it is urban morphology: the study of urban form as streets, blocks, plots and buildings. Before you add to a place, you have to be able to read what kind of place it already is.
Buildings come and go in decades; plots and streets last centuries. The oldest thing on your site is usually its boundary.
The figure-ground: the oldest map that still teaches
A figure-ground map fills the buildings solid black and leaves everything else white. Strip away colour, labels and land use, and what remains is pure form - the relationship between built mass (the figure) and open space (the ground). At a glance it tells you density, continuity, the width and rhythm of streets, and whether public space is shaped and contained or merely left over.
The trick that made it a design instrument is the Nolli map (Rome, 1748): invert it, so the public void - streets, squares, and even the accessible interiors of churches - becomes the solid figure. Suddenly you read the city as a system of connected rooms, which is how a pedestrian actually experiences it. A GIS makes both versions trivial from a single building-footprint layer, at any scale from a lane to a metropolis.
Colour hides form; black-and-white reveals it. Turn off every layer but the buildings and look.
The four elements, from street to building
Morphological analysis - the Conzenian tradition of urban geography - reads the city as a hierarchy of nested elements, each shaping the next. The street network divides land into blocks (the island of land bounded by streets). Each block is subdivided into plots (the individual land parcels, the unit of ownership and development). Each plot carries its building(s). The way these four fit together - the town plan in Conzen's terms - is remarkably persistent: streets and plots outlive the buildings on them by centuries, which is why a medieval plot pattern can still shape a modern high street.
For a designer this hierarchy is practical. It tells you the unit of change: a fine-plot street changes one building at a time and stays diverse; a superblock changes only wholesale, which is why superblocks so often flip from empty to mega-project with nothing in between.
Grain, and the numbers that pin it down
Grain is the size and repetition of the morphological units - fine grain means many small plots and buildings, coarse grain means few large ones. It is the single most useful word in morphology, and a GIS lets you replace the adjective with figures.
From a building-and-plot layer you can compute, per block or per hectare: the building coverage ratio (footprint area / plot or block area - how much of the ground is built on); the median plot size and its spread; the number of buildings per hectare; and the frontage grain (buildings or plots per 100 m of street). Add height (from a DEM difference, LiDAR, or attributes) and you get floor space index / FSI and a fuller three-dimensional picture. Cluster blocks by these numbers and distinct typologies fall out - bazaar street, gated enclave, industrial shed, villa plot - each a recognisable, measurable signature rather than a vibe.
Getting the footprints - and the scale trap
The bottleneck used to be data; it no longer is. Open, machine-learning-derived building footprints now cover most of India: Microsoft's GlobalMLBuildingFootprints and Google's Open Buildings (both free, with Overture Maps packaging building data too), plus OpenStreetMap where mappers are active. Any of these gives you a footprint layer to build figure-grounds and grain metrics at city scale in an afternoon.
Two honest cautions. First, quality varies: ML footprints can merge adjacent buildings, miss small or tin-roofed structures, and lag new construction - so ground-truth before you trust block-level counts. Second, the scale trap, formally the modifiable areal unit problem (MAUP): the grain numbers you get depend on the unit you measure over - per block, per hectare, per ward - and can change, even reverse, if you change that unit. Fix your unit deliberately and report it; a coverage ratio without its denominator is meaningless.
Grain measured 'per ward' and 'per block' can tell opposite stories - MAUP is not a footnote.
Microsoft Building Footprints
Free ML-derived building footprints with large India coverage (ODbL)
A fast open source of the figure for figure-ground and grain metrics; check for merged/missing buildings locally.
Google Open Buildings
Free ML building footprints focused on the Global South incl. South Asia (CC BY 4.0 / ODbL)
Alternative/complement to Microsoft's set; good coverage of Indian informal fabric, same quality cautions apply.
OpenStreetMap (OSM)
Community building + street + landuse polygons (ODbL)
Where mappers are active it gives plots and land use the ML sets lack; combine with imagery to fill gaps.
ISRO Bhuvan / Cartosat imagery
India national imagery to derive or verify footprints and grain
Use high-resolution imagery to ground-truth ML footprints and to digitise plots where vector data is missing.
Workshop - a figure-ground and a grain map of a district
Build a classic figure-ground from open building footprints, then quantify grain per block so "fine" and "coarse" become numbers. QGIS and ArcGIS paths run in parallel.
QGIS (free) with QuickOSM, or ArcGIS Pro; open building footprints (Microsoft / Google / OSM).
Given: a district of an Indian city
Dataset: Microsoft/Google/OSM building footprints (free) + OSM streets
Goal: a figure-ground map + a per-block building-coverage (grain) map
Time: ~75 minutes
- 1Load footprints. In QGIS: download the Microsoft or Google footprint tile for your area (or QuickOSM
building), add as a layer, style fill black on white background - that is your figure-ground. In ArcGIS Pro: add the same footprints and set a black fill on a white basemap. - 2Reproject to the local UTM zone (EPSG:32643/44/45) so all areas are in square metres.
- 3Build blocks. In QGIS: pull OSM
highway, then Vector > Geometry Tools >Polygonizethe street network to create block polygons. In ArcGIS Pro: useFeature To Polygonon the streets to make blocks. - 4Compute footprint area per building (QGIS: field calculator
$area; ArcGIS Pro:Calculate Geometry), then sum building area within each block (QGIS:Join attributes by location (summary); ArcGIS Pro:Summarize Within). - 5Divide summed building area by block area to get building coverage ratio per block, and graduate-colour the blocks by it - a grain map of the district.
- 6For a Nolli variant, invert the figure-ground (QGIS/ArcGIS:
Differencethe buildings from the district boundary) so the public void reads solid. Compare the two readings.
You’ll walk away with
A figure-ground map, a Nolli inversion, and a per-block coverage/grain map, with two or three typologies you can name from the numbers.
Three altitudes on the same idea
Read the band that fits you — or all three.
Morphology sets the terms your building must answer to. Reading the local grain, plot size, coverage ratio and frontage rhythm tells you what a contextual response is - whether to hold a continuous street wall or sit as an object in space - long before massing. A figure-ground of the block is the fastest context study you can make.
Typology mapping turns form into policy geography. Clustering blocks by grain and coverage identifies distinct urban fabrics that deserve distinct rules - a heritage bazaar core, a redevelopment-ready industrial belt, a stable villa suburb. Form-based reading of the city is the evidence base for form-based codes and differentiated FSI.
Grain is the lever between diversity and blankness. Fine grain gives varied frontage, many doors, and incremental change; coarse grain gives dead edges and all-or-nothing plots. When you draw a new quarter, the plot pattern you set - not the architecture - decides whether the streets will ever feel alive.
“A figure-ground is just an old-fashioned drawing - real analysis needs data.”
Do it yourself
No software - read grain with your eyes.
- 1Find your city on a satellite view and mentally fill the buildings black. Where is the grain finest, and where coarsest?
- 2Pick one block and estimate its building coverage - a third built? Two-thirds? That fraction is a real morphological number.
- 3Count the separate buildings (or doors) along 100 m of a lively street and of a dead one. Compare the frontage grain.
- 4Name the unit of change on a street you know: does it redevelop one plot at a time, or only as whole superblocks?
- 5Sketch the Nolli inversion of a square you like - which streets and interiors would you colour as public 'rooms'?
The one line to carry out
Peer-reviewed journals & authoritative standards
- 01Batty, M. — The New Science of Cities — MIT Press, 2013.
- 02Openshaw, S. — The Modifiable Areal Unit Problem (CATMOG 38) — Geo Books, Norwich, 1984.
- 03de Smith, M.J., Goodchild, M.F. & Longley, P.A. — Geospatial Analysis: A Comprehensive Guide, 7th ed. — Winchelsea Press, 2025.
- 04Environment and Planning B: Urban Analytics and City Science — SAGE, ongoing.
Grain and configuration shape movement on foot; the last lesson of the module scales up to the network that moves a city - transit - and how we measure access to it.
The author
Amogh N P
Architect, interior designer, and creative polymath. Studio Matrx began in his notebooks — his vision of design made honest, useful, and open to everyone. Its Academy is written and taught in his memory, and free, forever.
More about Amogh →