
 Lesson 8.2
Lesson 8.2 · Occupant Experience & Wellbeing
Indoor Air Quality Monitoring
CO2, PM2.5, VOCs and humidity - the invisible variables that shape health and thinking
You cannot see the air you breathe eight hours a day - but it is measurably changing how well you think. Sensing makes it visible, and visibility makes it fixable.
For most of history a building told you nothing about its air. You noticed only the extremes: a stuffy meeting room, a paint smell, a damp corner. Everything in between - the slow rise of CO2 through an afternoon, the particulates from outside traffic, the off-gassing of a new carpet - was invisible, and therefore unmanaged.
Cheap sensors changed that. Indoor air quality monitoring turns the unseen into numbers you can act on: carbon dioxide, fine particulates, volatile organic compounds and humidity, streaming into the twin. And once air is visible, two things follow - ventilation can respond to the actual load instead of a fixed timetable, and occupants can finally see the thing they have been breathing all along.
CO2<800 good, ~1000 act, PM2.5 health, VOC events, RH 40-60. DCV = ventilate to the load.
Why indoor air quality matters more than we treated it
People in developed economies spend roughly ninety percent of their lives indoors, so the air inside is the air that actually matters for health - far more than the outdoor air that gets all the attention. Poor indoor air is linked to headaches, fatigue, respiratory irritation and worse, and the pandemic pushed this from a niche facilities concern to a boardroom one: ventilation became a visible proxy for whether a shared space was safe.
The finding that changed how designers think, though, is about cognition. Controlled studies have measured decision-making performance falling as indoor CO2 rises - not because CO2 at these concentrations is toxic, but because elevated CO2 is a reliable marker of under-ventilation, and under-ventilated air carries a soup of other bioeffluents and pollutants. When the air goes stale, people think measurably less well: slower, less strategic, more error-prone. For a knowledge-work building, that is not a wellness nicety - it is productivity leaking away invisibly. This reframes IAQ from a compliance box into one of the clearest business cases in the whole smart-building field: better air is cheaper than the cognitive tax of bad air. It is also deeply relevant in cities with high outdoor particulate loads, where the building envelope and its filtration are the last line of defence for the people inside.
What makes air different from most of the building's other systems is that occupants have almost no way to sense it themselves. You feel when a room is too warm and you see when it is too dark, and you act - but you cannot feel 1200 ppm of CO2 or see PM2.5, and by the time a room smells stuffy the air has been degrading for a while. Air is the one comfort variable that is genuinely invisible, which is precisely why measuring it is so valuable: it converts a hazard people cannot perceive into a number they can. That invisibility also explains why air was historically the most neglected variable - there was no cheap feedback, so it was managed by rule of thumb and worst-case duct sizing. The arrival of low-cost, reliable sensing did not just add a data stream; it made an entire dimension of the indoor environment manageable for the first time, which is why IAQ monitoring has moved so quickly from novelty to expectation.
The four signals worth sensing
You do not need a laboratory to monitor air usefully - a handful of signals covers most of what matters. Carbon dioxide (CO2), measured in parts per million, is the workhorse. Outdoor air sits around 420 ppm; a well-ventilated room stays under about 800; above 1000 ppm the air feels stuffy and ventilation is clearly lagging occupancy; well above that, cognition suffers. CO2 is prized because it is a direct proxy for how much fresh air each person is getting.
Fine particulate matter (PM2.5) - particles under 2.5 microns, from traffic, cooking, smoke and outdoor pollution - lodges deep in the lungs and is one of the most health-critical measures, usually reported in micrograms per cubic metre. Volatile organic compounds (VOCs) are gases off-gassed by paints, adhesives, furniture, cleaning products and printers; sensors typically give a relative index rather than a precise concentration, useful for spotting events like a cleaning cycle or a new fit-out. Relative humidity (RH) matters at both ends: too dry (below about 30 percent) irritates eyes and airways, too damp (above about 60 percent) invites mould and dust mites; the 40 to 60 percent band is the healthy target. Some deployments add carbon monoxide, radon or formaldehyde where the risk profile warrants. The art is choosing the few signals that actually drive a decision, calibrating them, and not drowning the twin in noise.
CO2 = enough fresh air? PM2.5 = health. VOC = events. RH = 40-60% comfort band.
Demand-controlled ventilation: let the air call for air
Traditional ventilation is dumb by design: a fixed volume of fresh air on a fixed schedule, sized for a worst-case full room and running whether the space holds fifty people or nobody. That either wastes enormous energy conditioning fresh air no one needs, or under-ventilates when the room is fuller than assumed. Demand-controlled ventilation (DCV) closes that gap by driving the fresh-air rate from a live signal - most commonly CO2, sometimes occupancy counts or a blended IAQ index.
The control loop is exactly the kind you have met throughout this course. An IAQ sensor reports CO2; a controller compares it to a threshold - say 1000 ppm; if the reading climbs above the band it opens dampers or ramps the air handler to bring in more outdoor air; as CO2 falls back it throttles down to save energy. It is a classic feedback loop, often a PID or staged control, closing on air quality instead of temperature. The payoff is real on both sides of the ledger: ventilate a busy room properly and stop over-ventilating an empty one. In a mixed-mode or naturally ventilated building the same logic can prompt occupants - a simple open a window nudge on the app when CO2 climbs. Done well, DCV is one of the clearest wins in smart buildings: measurable energy saved and measurably better air, from the same sensor. Done badly - one poorly placed sensor speaking for a whole floor - it can starve some rooms while flooding others, which is why sensor placement and calibration are not afterthoughts.
A worked example: one meeting room across an afternoon
Put the pieces together in a single room. It is 1pm; a six-person meeting room is empty and its CO2 reads 480 ppm, close to outdoor air - the overnight purge and the morning's light use have kept it fresh. At 2pm eight people crowd in for a long workshop. With eight sets of lungs in a small sealed box, CO2 climbs fast - past 800 within twenty minutes, through 1000 by half past, heading for 1400 and the stuffy, foggy-headed zone by 3pm if nothing intervenes. On the old fixed schedule, nothing would: the air handler pushes the same volume it always does, sized for an average that this room has just blown past.
With demand-controlled ventilation the story changes. The CO2 sensor crosses the 1000 ppm threshold; the controller ramps the supply of outdoor air to that zone; CO2 stabilises and then falls back toward the band even with the room full. The occupants never notice the intervention - they just keep thinking clearly, which is the entire point. Meanwhile two other things happen quietly. The occupant app can nudge the organiser (this room is filling with CO2 - the system is adding fresh air), and the twin logs the whole episode: a room that regularly spikes might be under-ventilated for its real use, a design insight no static calculation would surface. At 4pm the room empties; CO2 decays; the controller throttles back so the building is not conditioning fresh air for an empty box. That single afternoon shows the whole thesis of the lesson - a signal made visible, a loop that acts on the real load, energy saved at both ends, and a record the twin can learn from - and it also shows the limits, because the same green CO2 reading says nothing about a solvent smell from the whiteboard markers or particulates drifting in from the street. The number is a good servant and a bad master.
Demand-controlled ventilation (DCV)
Ventilation rate driven by a live IAQ or occupancy signal
Usually a CO2-driven feedback loop; saves energy and improves air from the same sensor when placed and calibrated well.
CO2 sensing (NDIR)
Parts-per-million proxy for fresh air per person
Under 800 good, around 1000 the action point, well above stuffy; a marker of ventilation, not a toxin at these levels.
PM2.5 / particulate sensing
Fine-particle mass, health-critical
Reported in micrograms per cubic metre; low-cost optical sensors are indicative and need calibration.
ASHRAE ventilation guidance
Fresh-air rates and IAQ practice
Frames minimum ventilation; DCV modulates around it rather than replacing the requirement.
Workshop - watch CO2 tell the story of a room
CO2 is the easiest IAQ signal to read and the most revealing, because it tracks people and ventilation in near real time. If you can get a monitor, watch one room breathe across a day.
A CO2 monitor (inexpensive NDIR units are widely available, or borrow one) and a notebook. PM2.5 and VOC readings are a bonus if the device provides them.
Goal: see ventilation lag occupancy, and imagine the control response
Inputs: a CO2 monitor (or a colleague who has one), one occupied room, a notebook
Time: one working day of occasional readings
- 1Place or borrow a CO2 monitor in a room that fills and empties - a meeting room, studio or classroom. Note the baseline reading when it is empty (expect roughly 420 to 600 ppm).
- 2Record the reading every 30 to 60 minutes through the day, noting how many people are present and whether windows or mechanical ventilation are on.
- 3Plot CO2 against occupancy. Watch it climb through a full meeting - often past 1000, sometimes well beyond - and fall when the room empties or a window opens. That lag is the problem DCV solves.
- 4Mark the moment it crosses 1000 ppm. Ask: if this were driving demand-controlled ventilation, what should have happened, and how much earlier?
- 5Sketch the control loop for this room - sensor, threshold, damper or window prompt, feedback - and note where you would place the sensor so it speaks for the whole space, not just one corner.
You’ll walk away with
A CO2-versus-occupancy chart for one real room across a day, annotated with the point ventilation fell behind, plus a sketched demand-controlled ventilation loop and a note on sensor placement.
Three altitudes on the same idea
Read the band that fits you — or all three.
Good air starts with the section, not the sensor. Ventilation strategy, envelope tightness, operable windows, filtration and where you place air handlers decide how much the controls can achieve. Design for measurable fresh-air delivery per person and leave room - literally, in ducts and plenums - for demand-controlled ventilation to modulate. In high-pollution cities, filtration and a tight envelope are a health decision, not a luxury.
You specify much of what off-gasses. Low-VOC paints, adhesives, carpets and furniture directly lower the VOC load your sensors will read, and material choices shape humidity and dust. You also own how air quality is shown - a lobby display, an app tile, a plant wall paired with a live reading. Making air visible is an experience decision, and increasingly one tenants ask for by name.
Learn the four signals and their honest ranges cold - CO2, PM2.5, VOCs, RH - and what each is a proxy for. Then learn why CO2 predicts cognition and how a demand-controlled ventilation loop works. This is one of the clearest, most defensible value stories in smart buildings, which makes it a strong thing to be genuinely fluent in early.
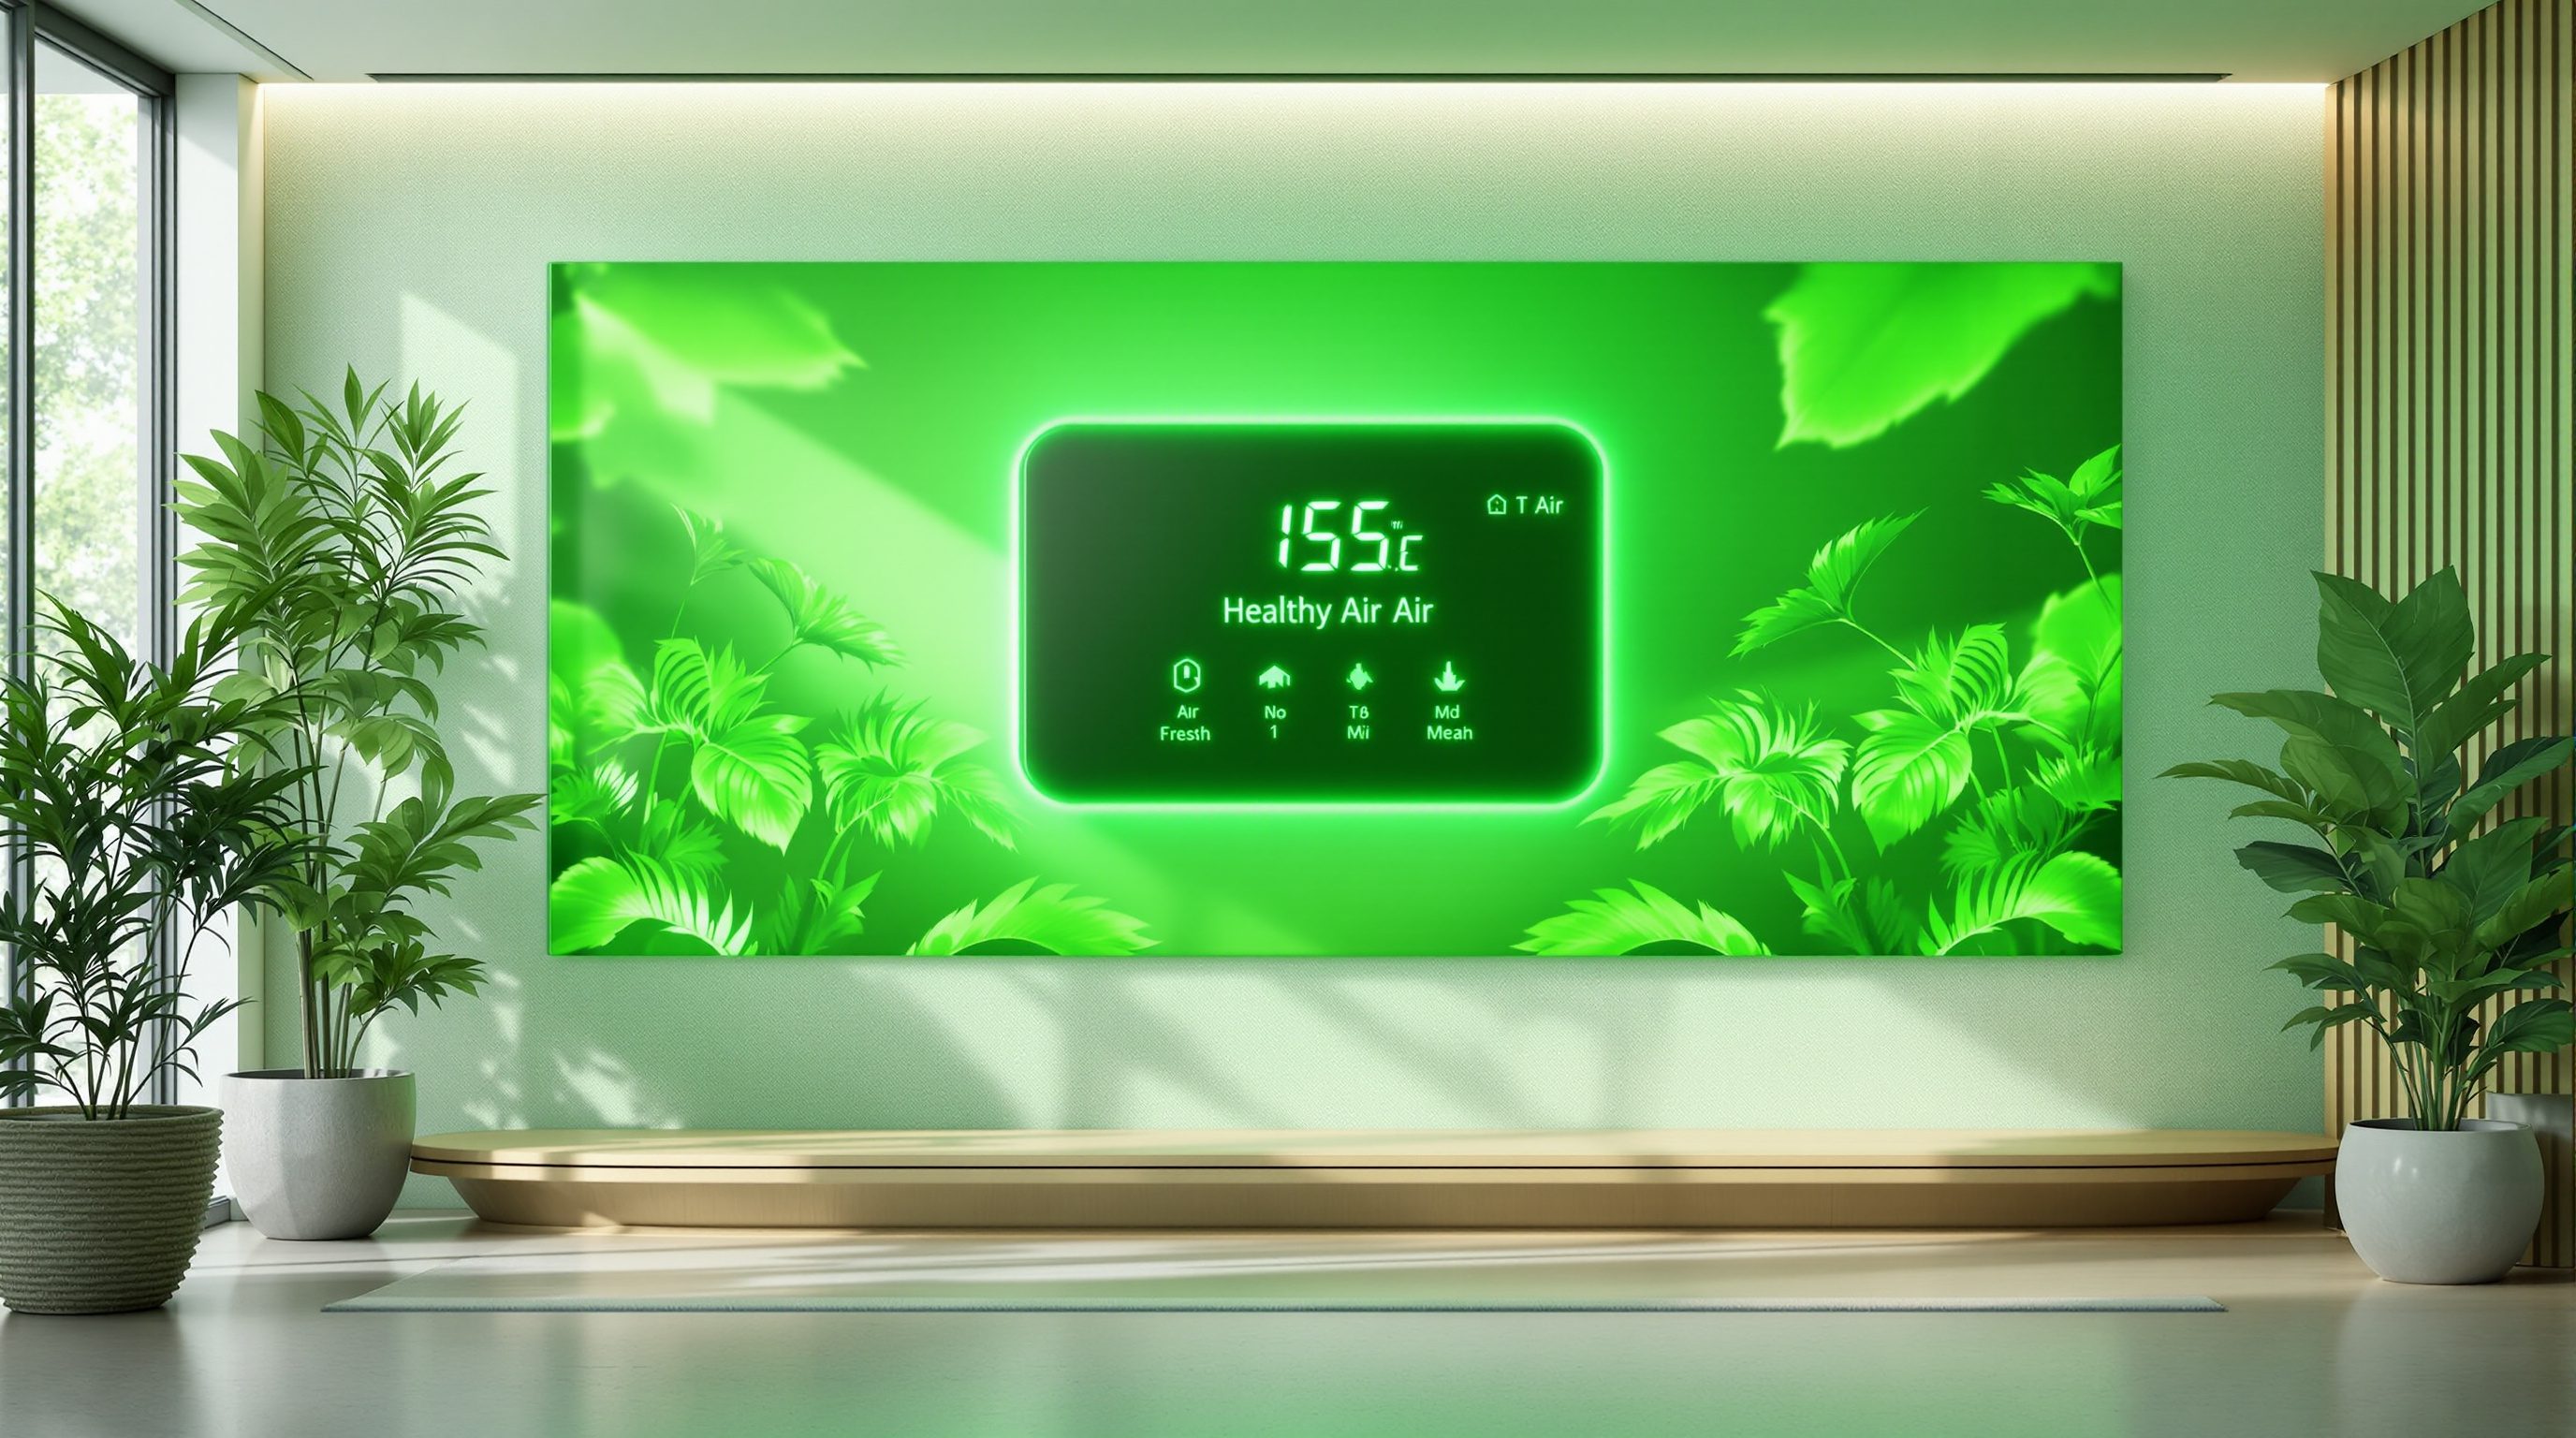
“A green air quality dashboard means the air is healthy.”
Do it yourself
Check your grasp of the signals.
- 1What does indoor CO2 actually tell you, and why does it predict cognition?
- 2Roughly what CO2 level marks the point where ventilation is clearly lagging?
- 3Why is PM2.5 one of the most health-critical measures, and where does it come from?
- 4Explain the demand-controlled ventilation loop in one sentence.
- 5Why is a green IAQ dashboard not the same as healthy air?
The one line to carry out
Peer-reviewed journals & authoritative standards
- 01Indoor air quality — Wikipedia, 2026.
- 02Sensor — Wikipedia, 2026.
- 03HVAC control system — Wikipedia, 2026.
- 04ASHRAE — ASHRAE, 2026.
We have made the air legible. Next we build the whole occupant-facing layer - the apps through which people see air quality, book space, find their way and ask the building for what they need.
The author
Amogh N P
Architect, interior designer, and creative polymath. Studio Matrx began in his notebooks — his vision of design made honest, useful, and open to everyone. Its Academy is written and taught in his memory, and free, forever.
More about Amogh →