
 Lesson 8.4
Lesson 8.4 · Optimization & Design-Space Exploration
Design-Space Exploration
Beyond a single best - generating, comparing and learning from many variants
The best thing a search gives you is rarely the winner. It's the map - the sense of how your problem behaves that a hundred variants leave in your head.
This module has been climbing toward single points: Galapagos's best, Wallacei's front. But a strange thing happens when you optimize honestly - the single 'answer' turns out to be the least interesting part. What you actually carry away is an understanding of the problem: which parameters matter, where the good regions are, what fights what.
Design-space exploration makes that the explicit goal. Instead of asking 'what is best?', you ask 'what is possible, and what does the space of possibilities look like?' You generate many variants, sample the space deliberately, compare them, and use the whole exercise to think - with your judgement steering throughout.
Don't chase the one winner - map the space, learn the problem, keep judgement in the loop.
From one best to a whole space
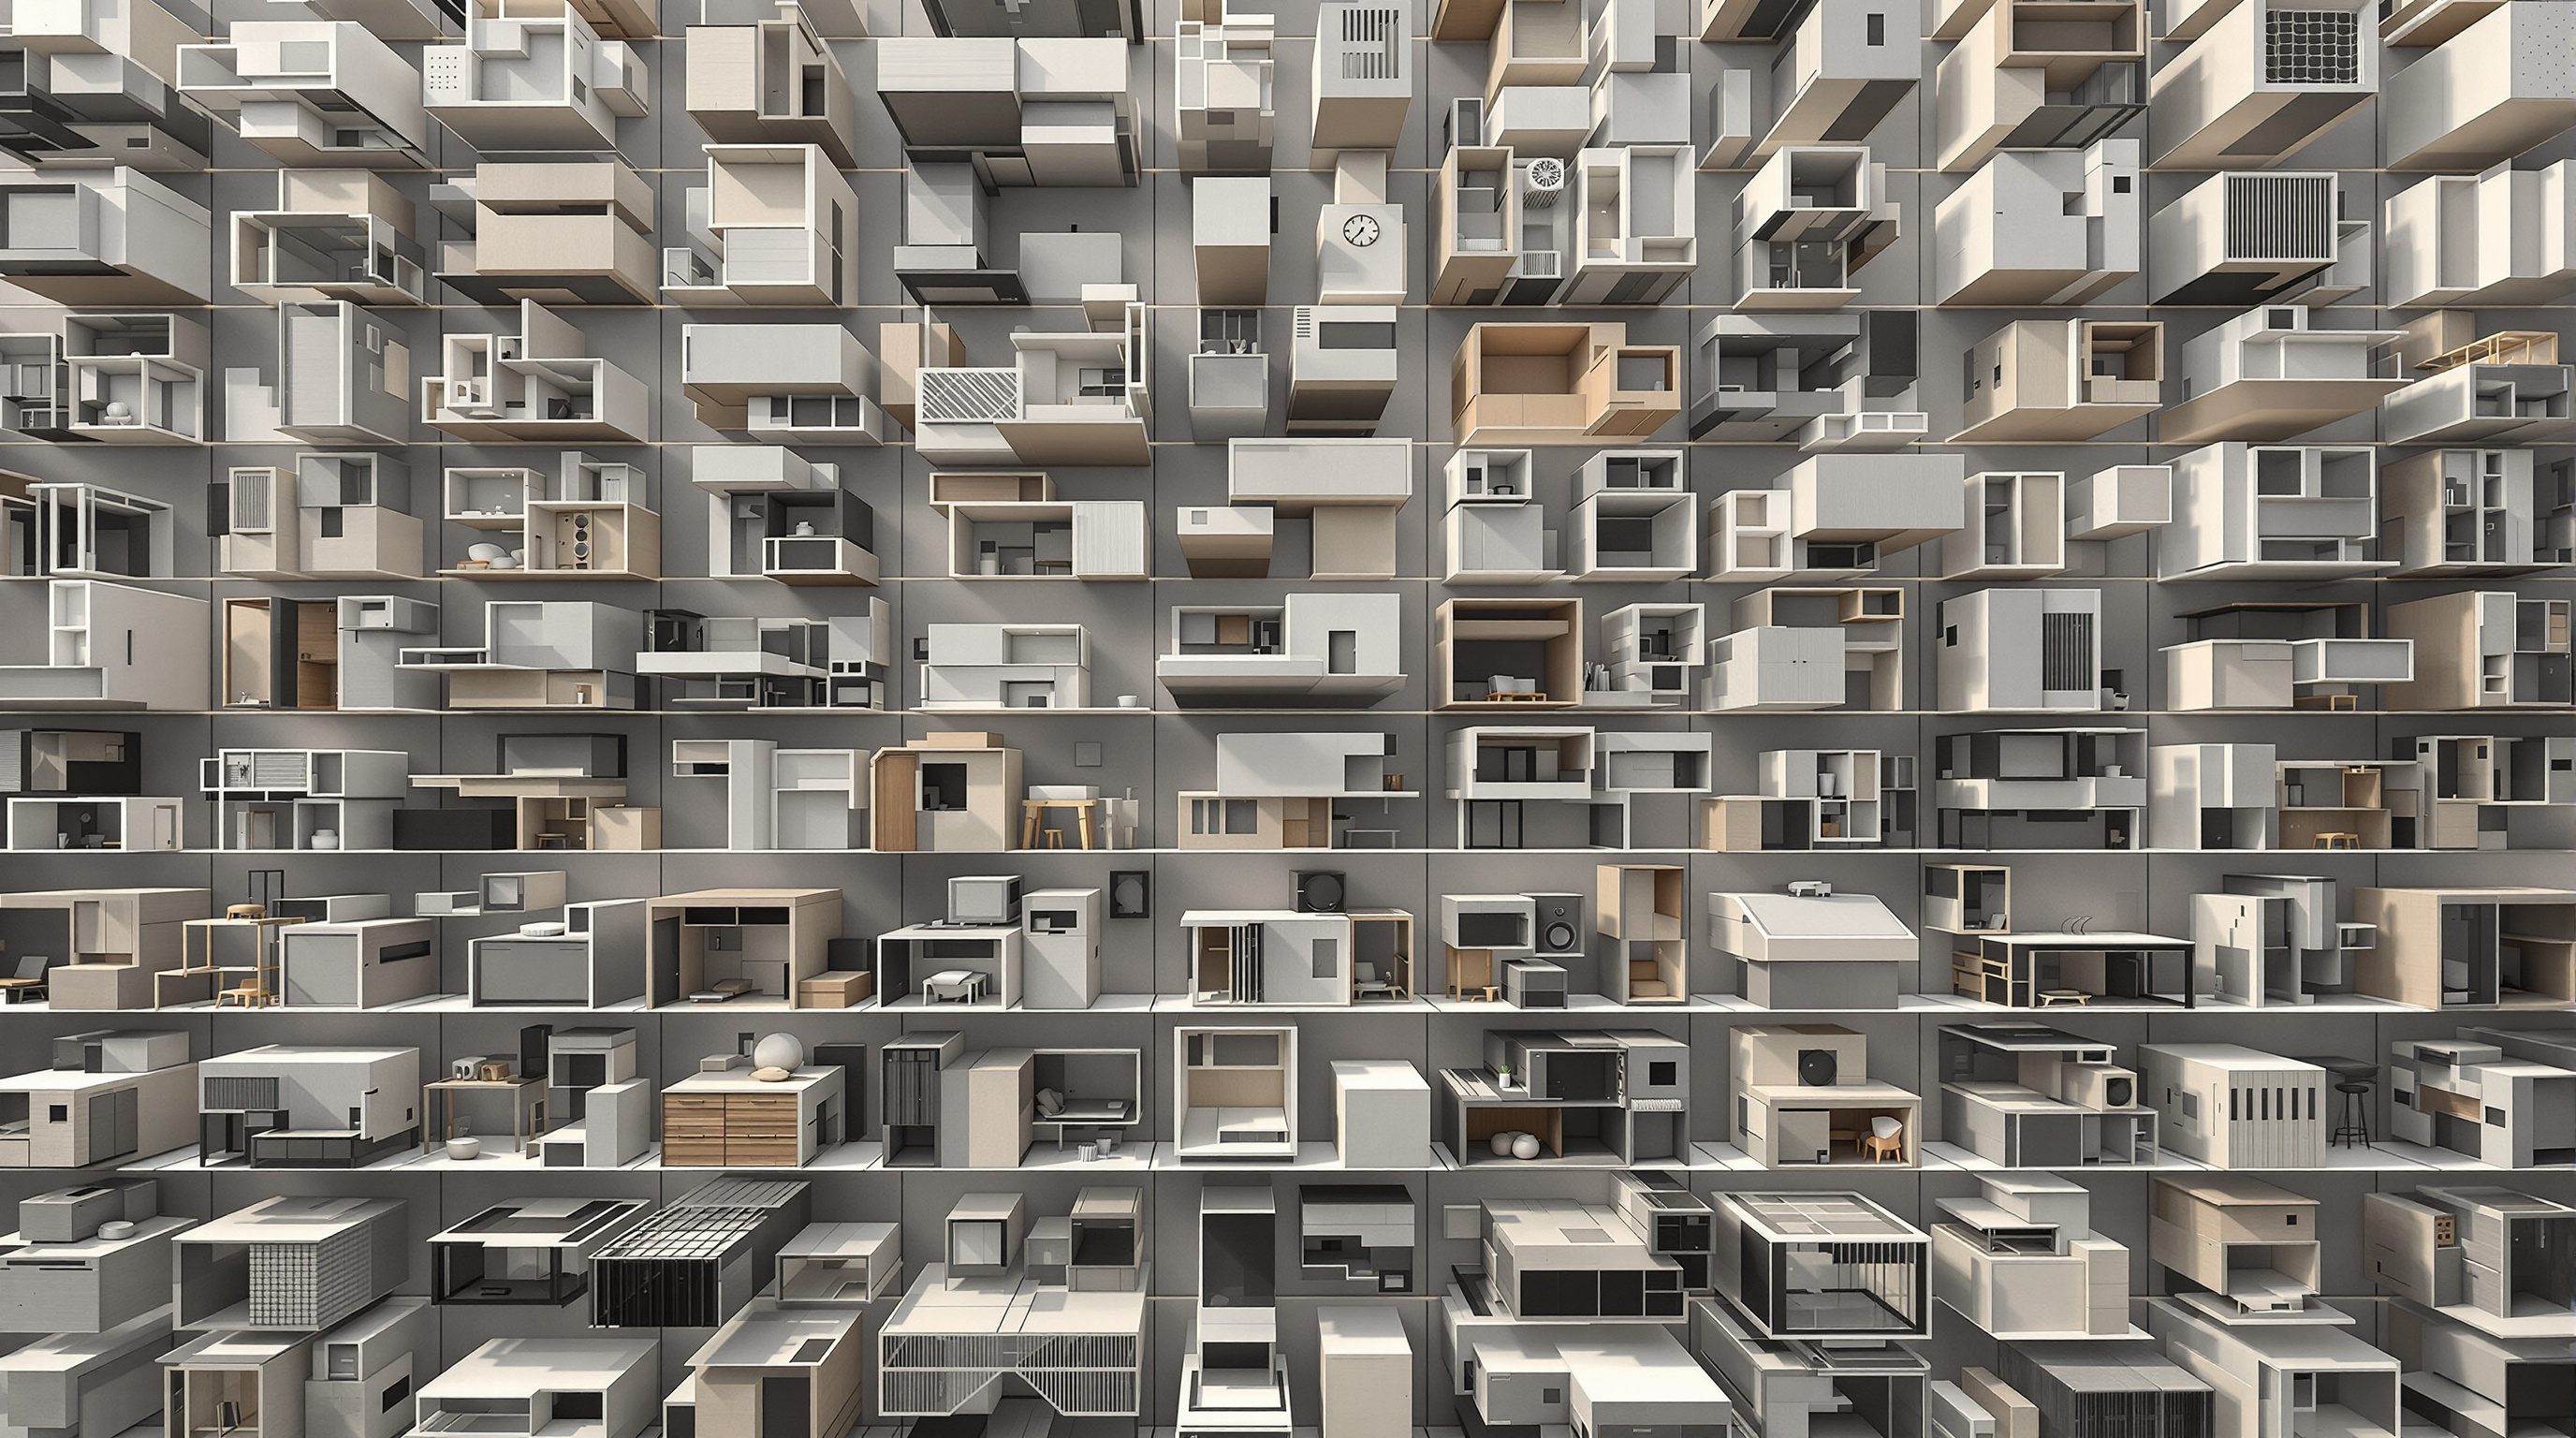
Recall the very first lesson of this course: a parametric definition is not one design, it is an engine that can produce a whole design space - the complete set of variants its parameters can generate. Optimization walks that space looking for peaks. Design-space exploration steps back and studies the terrain itself.
The shift is from a verdict to a map. A solver's single winner tells you where the high ground is but almost nothing about the country around it - how steep the climb was, whether there were many good options or one lucky one, what you would lose by moving. For a designer that surrounding context is often more valuable than the summit, because real projects change: the brief moves, the budget shifts, the client prefers the look of the runner-up. If you understand the whole space, you can respond; if you only have 'the answer', you are stranded when it stops fitting.
So the practical move is to keep, not discard, the variants a search generates. Instead of throwing away everything but the winner, you collect them, compare them, and read the patterns. The output of exploration is not a building - it is a well-founded intuition about your problem, plus a curated shortlist of strong, different options to design with.
There is a practical dividend, too. Projects rarely hold still - the budget tightens, the brief gains a floor, the client falls for the runner-up. If all you kept was 'the answer', every such change sends you back to square one. If you kept the map, you already know where the neighbouring good designs are and roughly what moving costs, so you adapt in an afternoon instead of a fortnight. Exploration is, among other things, cheap insurance against the future.
A solver gives you the peak. Exploration gives you the whole map around it - often more useful.
Sampling: how to cover a space without evaluating everything
You cannot render every design - three sliders of twenty positions is 8,000 variants; five is over three million. So exploration is really about sampling: choosing a representative subset that reveals the space's behaviour without evaluating all of it.
The simplest scheme is a full-factorial grid: pick a handful of values for each parameter and cross them - clean and complete for two or three parameters, but it explodes combinatorially and wastes points on unimportant axes. For more parameters, space-filling schemes are smarter: random sampling, or better, Latin-hypercube sampling, which spreads points so every parameter is evenly covered without the cost of a full grid. The goal is coverage - no large unexplored gaps, no wasted clustering.
In Grasshopper this is very doable. For a small grid you can drive sliders with Cross Reference over lists of values and record each result. For serious work, tools like Colibri (part of the TT Toolbox / Design Explorer ecosystem) iterate a definition over sampled parameter combinations and export every variant's inputs, its performance metrics and an image to a data file. You then load that file into a parallel-coordinates explorer (Design Explorer) and interactively filter thousands of variants - drag a slider to 'show me only the ones under this cost' and watch which forms survive. That is exploration you can actually navigate.
Using optimization to LEARN about the problem
Here is the reframing that makes you better at this: run solvers not (only) to win, but to interrogate the problem. A search is a giant, cheap experiment on your own design, and its by-products are gold.
Which parameters actually matter? If a gene barely moves any objective across the whole run, it is a dial you can stop worrying about - simplify. If one gene dominates, that is where the design lives. Where are the good regions, and are they broad or narrow? A wide plateau of good designs is robust - small changes on site won't wreck it - while a lone sharp peak is fragile and risky to build near. What genuinely trades against what? The Pareto front from Wallacei is really a lesson about the physics of your problem, not just a menu. What surprised you? The most valuable variants are often the ones you did not expect to be good; they reveal an assumption you did not know you were making.
This is optimization as sensitivity analysis and hypothesis-testing. You come out not with 'the answer' but with a mental model: I understand how this facade behaves, which moves pay off, where the cliffs are. That understanding transfers to the next project in a way a single winning geometry never does.
Keeping human judgement in the loop
Every technique in this module quietly points to one conclusion: the computer searches, but the designer decides. That is not a consolation prize for humans - it is the correct division of labour, and treating it that way is what separates a designer who uses these tools from one the tools use.
The machine is superb at the things you are bad at: evaluating thousands of options tirelessly, quantifying performance, finding non-obvious combinations, exposing trade-offs. You are superb at the things it cannot touch: choosing which objectives are worth measuring, judging beauty, context, delight and appropriateness, sensing when a metric has drifted from intent, and taking responsibility for a real building in front of real people and codes and engineers. A design space is a set of options; only judgement turns options into architecture.
So run the search, then come back. Read the winners against everything you did not (and could not) measure. Prefer robust regions over fragile peaks when the real world is messy. Keep the surprising runner-up in the conversation. And never let a fitness number - however confident - overrule structural, fire or life-safety judgement, which belongs with qualified engineers. Used this way, optimization does not shrink the designer's role; it amplifies it, handing you a sharper map so your judgement can range further. That is the whole point of letting the computer search.
Building an exploration you can actually navigate
Generating a thousand variants is easy; making them navigable is the real craft, and it is what turns a pile of images into insight. Three habits make the difference.
First, record structure, not just pictures. For every variant, store its input parameter values, its performance metrics and a thumbnail together, as one row. Colibri's export does this natively - a spreadsheet of inputs, outputs and images - and it is the difference between a folder you can query and a folder you can only scroll. When each design carries its own numbers, you can sort, filter and correlate; without them you are just admiring screenshots.
Second, use the right viewer. A parallel-coordinates plot (as in Design Explorer) lets you drag a bracket on any axis - 'show me only variants under this cost and above this daylight' - and instantly see which forms survive and which parameter values they share. That interactive filtering is where patterns leap out: you watch the space respond to a constraint rather than guessing.
Third, curate, don't dump. The deliverable of exploration is never all thousand variants - it is a small, deliberately diverse shortlist plus the story of what you learned. Three genuinely different strong options, each with a one-line rationale, are worth more to a client or examiner than a contact sheet of near-duplicates. Diversity matters more than raw count here: five options that explore different strategies teach far more than fifty minor variations on one. The machine casts the wide net; your judgement decides what is worth keeping.
Design space
The full set of variants a definition can produce
Exploration studies this space; optimization searches it. Introduced in Module 0, closed here.
Colibri (TT Toolbox)
Grasshopper component that iterates a definition over sampled parameters
Exports inputs, metrics and images per variant for external exploration. Part of the Design Explorer workflow.
Design Explorer
Web parallel-coordinates tool for browsing many variants
Interactively filter thousands of designs by any metric. Pairs with Colibri's exported data.
Latin-hypercube sampling
A space-filling way to sample many parameters efficiently
Covers each parameter evenly without a full-factorial grid's combinatorial blow-up. Good for high-dimensional spaces.
Workshop - map a design space and curate a shortlist
You will generate many variants from one definition, sample the space deliberately, and practise the real deliverable of this module: a curated shortlist plus what you _learned_ about the problem.
Rhino + Grasshopper; optionally Colibri / TT Toolbox + Design Explorer for automated iteration and browsing. A light definition so many variants evaluate quickly.
Goal: explore rather than optimize - produce a map and a judged shortlist
Inputs: a parametric definition with 2-4 meaningful parameters and at least one performance metric
Time: ~75 minutes
- 1Choose 2-4 parameters and one or two metrics. For two or three parameters, set up a full-factorial grid (drive sliders with Cross Reference over value lists); for more, sample the space with a space-filling set of combinations instead.
- 2Generate and record every sampled variant - capture its parameter values, its metric(s) and a small image. (Colibri automates the capture-and-export; even a manual grid of screenshots works for a first pass.)
- 3Lay the variants out as a comparison grid or load the exported data into Design Explorer, and just look. Filter by your metric and watch which forms survive - and which parameters barely change anything.
- 4Write down what you LEARNED: which parameter dominated, which was nearly irrelevant, where the good region sat and whether it was broad (robust) or narrow (fragile), and which variant surprised you.
- 5Curate a shortlist of three genuinely different strong variants - not the single best, but a spread - and write a one-line judged rationale for each, including at least one concern the metric did not capture.
You’ll walk away with
A one-page design-space map: the sampled variant grid (or Design Explorer view), a short 'what I learned' paragraph on parameter importance and robustness, and a curated shortlist of three distinct variants each with a human rationale.
Three altitudes on the same idea
Read the band that fits you — or all three.
Exploration is how you keep options alive through a moving brief. Present not one optimized scheme but a curated set of strong, distinct variants and the map behind them, and you can pivot when the budget or programme shifts without starting over. It also arms you for the client meeting: 'here are three genuinely different good answers, and here is what each costs you' is a far stronger position than defending a lone optimum.
A variant grid is one of the most persuasive tools in a client conversation. Rather than asking a client to imagine alternatives, show a comparison board of layouts or screen patterns generated from one definition, each labelled with its trade-off. You stay in control of taste and atmosphere - the things no metric captures - while using the computer to make sure you've genuinely explored, not settled on the first idea.
Exploration is what turns a technical exercise into a design story. In a portfolio, a page that shows the sampled space, the patterns you found ('taper barely mattered; twist drove everything'), and the shortlist you curated demonstrates thinking, not button-pushing. Examiners reward the student who used the search to understand the problem and then made a judged choice - that narrative is the whole module in one spread.
“The point of optimization is to let the computer decide the design for you.”
Do it yourself
Zoom out and reflect.
- 1Why is the 'map' of a design space often more useful than the single best point?
- 2Why can't you just evaluate every possible design, and what do you do instead?
- 3Name two things a search can teach you about your problem beyond 'which is best'.
- 4What is the difference between a broad good region and a lone sharp peak, and why does it matter for building?
- 5State the division of labour between the computer and the designer in one sentence.
The one line to carry out
Peer-reviewed journals & authoritative standards
- 01Autodesk - What is generative design — Autodesk, 2026.
- 02Multi-objective optimization — Wikipedia, 2026.
- 03Woodbury, R. - Elements of Parametric Design — Routledge, 2010.
- 04food4rhino - Grasshopper plug-ins ecosystem — Robert McNeel & Associates, 2026.
You can now let the computer search a space you defined - and read what it finds with judgement intact. Module 9 closes the loop with the real world: environmental analysis and fabrication, where your optimized geometry meets sun, energy and the machines that build it.
The author
Amogh N P
Architect, interior designer, and creative polymath. Studio Matrx began in his notebooks — his vision of design made honest, useful, and open to everyone. Its Academy is written and taught in his memory, and free, forever.
More about Amogh →