
Understanding Organic Loading in STPs: OLR, F/M Ratio and Tank Sizing
What organic loading really means, why it — not just flow — decides how big your aeration tank must be, and the typical OLR and F/M ranges for ASP, MBBR, SBR and MBR, explained for the Indian context.
Ask most people how big a sewage treatment plant needs to be and they will answer in litres per day — the flow. That number matters, but it is only half the story. A hostel mess, a hotel kitchen and a residential tower can all send the same volume of water to their STPs and yet need very differently sized tanks, because the strength of their sewage differs. What separates a well-behaved plant from one that foams, stinks and fails its consent limits is usually not how much water arrives, but how much pollution arrives inside it. That quantity is the organic load, and understanding it is the difference between a plant that is designed and one that is merely guessed.
Flow fills the tank; organic load feeds the bugs. Size an STP on litres alone and you have sized the plumbing but not the biology — and it is the biology that has to meet the discharge standard.
What "organic loading" actually means
The organic load on an STP is the mass of biodegradable pollution — measured as BOD — delivered to it every day. It is not a concentration and not a flow; it is the two multiplied together:
Organic load (kg BOD/day) = Flow (m³/day) × BOD (mg/L) ÷ 1000
A 500 KLD plant treating sewage at 250 mg/L BOD carries 500 × 250 ÷ 1000 = 125 kg BOD/day. That kilograms-per-day figure — not the 500 KLD — is what the microbial population in the aeration tank must consume. If you have not yet met BOD, COD and TSS as measures of sewage strength, the wastewater characteristics guide is the place to start; everything below builds on it.
From that single daily mass, engineers derive two ratios that govern the whole biological design.
The two numbers that matter: OLR and F/M
Volumetric organic loading rate (OLR)
The organic loading rate spreads the daily load over the volume of the biological reactor:
OLR (kg BOD/m³/day) = kg BOD per day ÷ aeration tank volume (m³)
It answers a blunt question: how much pollution are we asking each cubic metre of tank to handle? Load a tank too lightly and you have paid for concrete you do not use. Load it too heavily and the microbes cannot keep up — BOD breaks through into the effluent, oxygen demand outstrips the blowers, and the plant fails. OLR is therefore the master dial for tank size: fix the load and the target OLR, and the required volume falls straight out.
Food-to-microorganism ratio (F/M)
OLR looks at the tank; F/M looks at the workforce inside it. It compares the food arriving each day to the mass of microbes available to eat it:
F/M = kg BOD per day ÷ (MLSS in kg) = kg BOD/day ÷ (MLSS mg/L × volume m³ ÷ 1000)
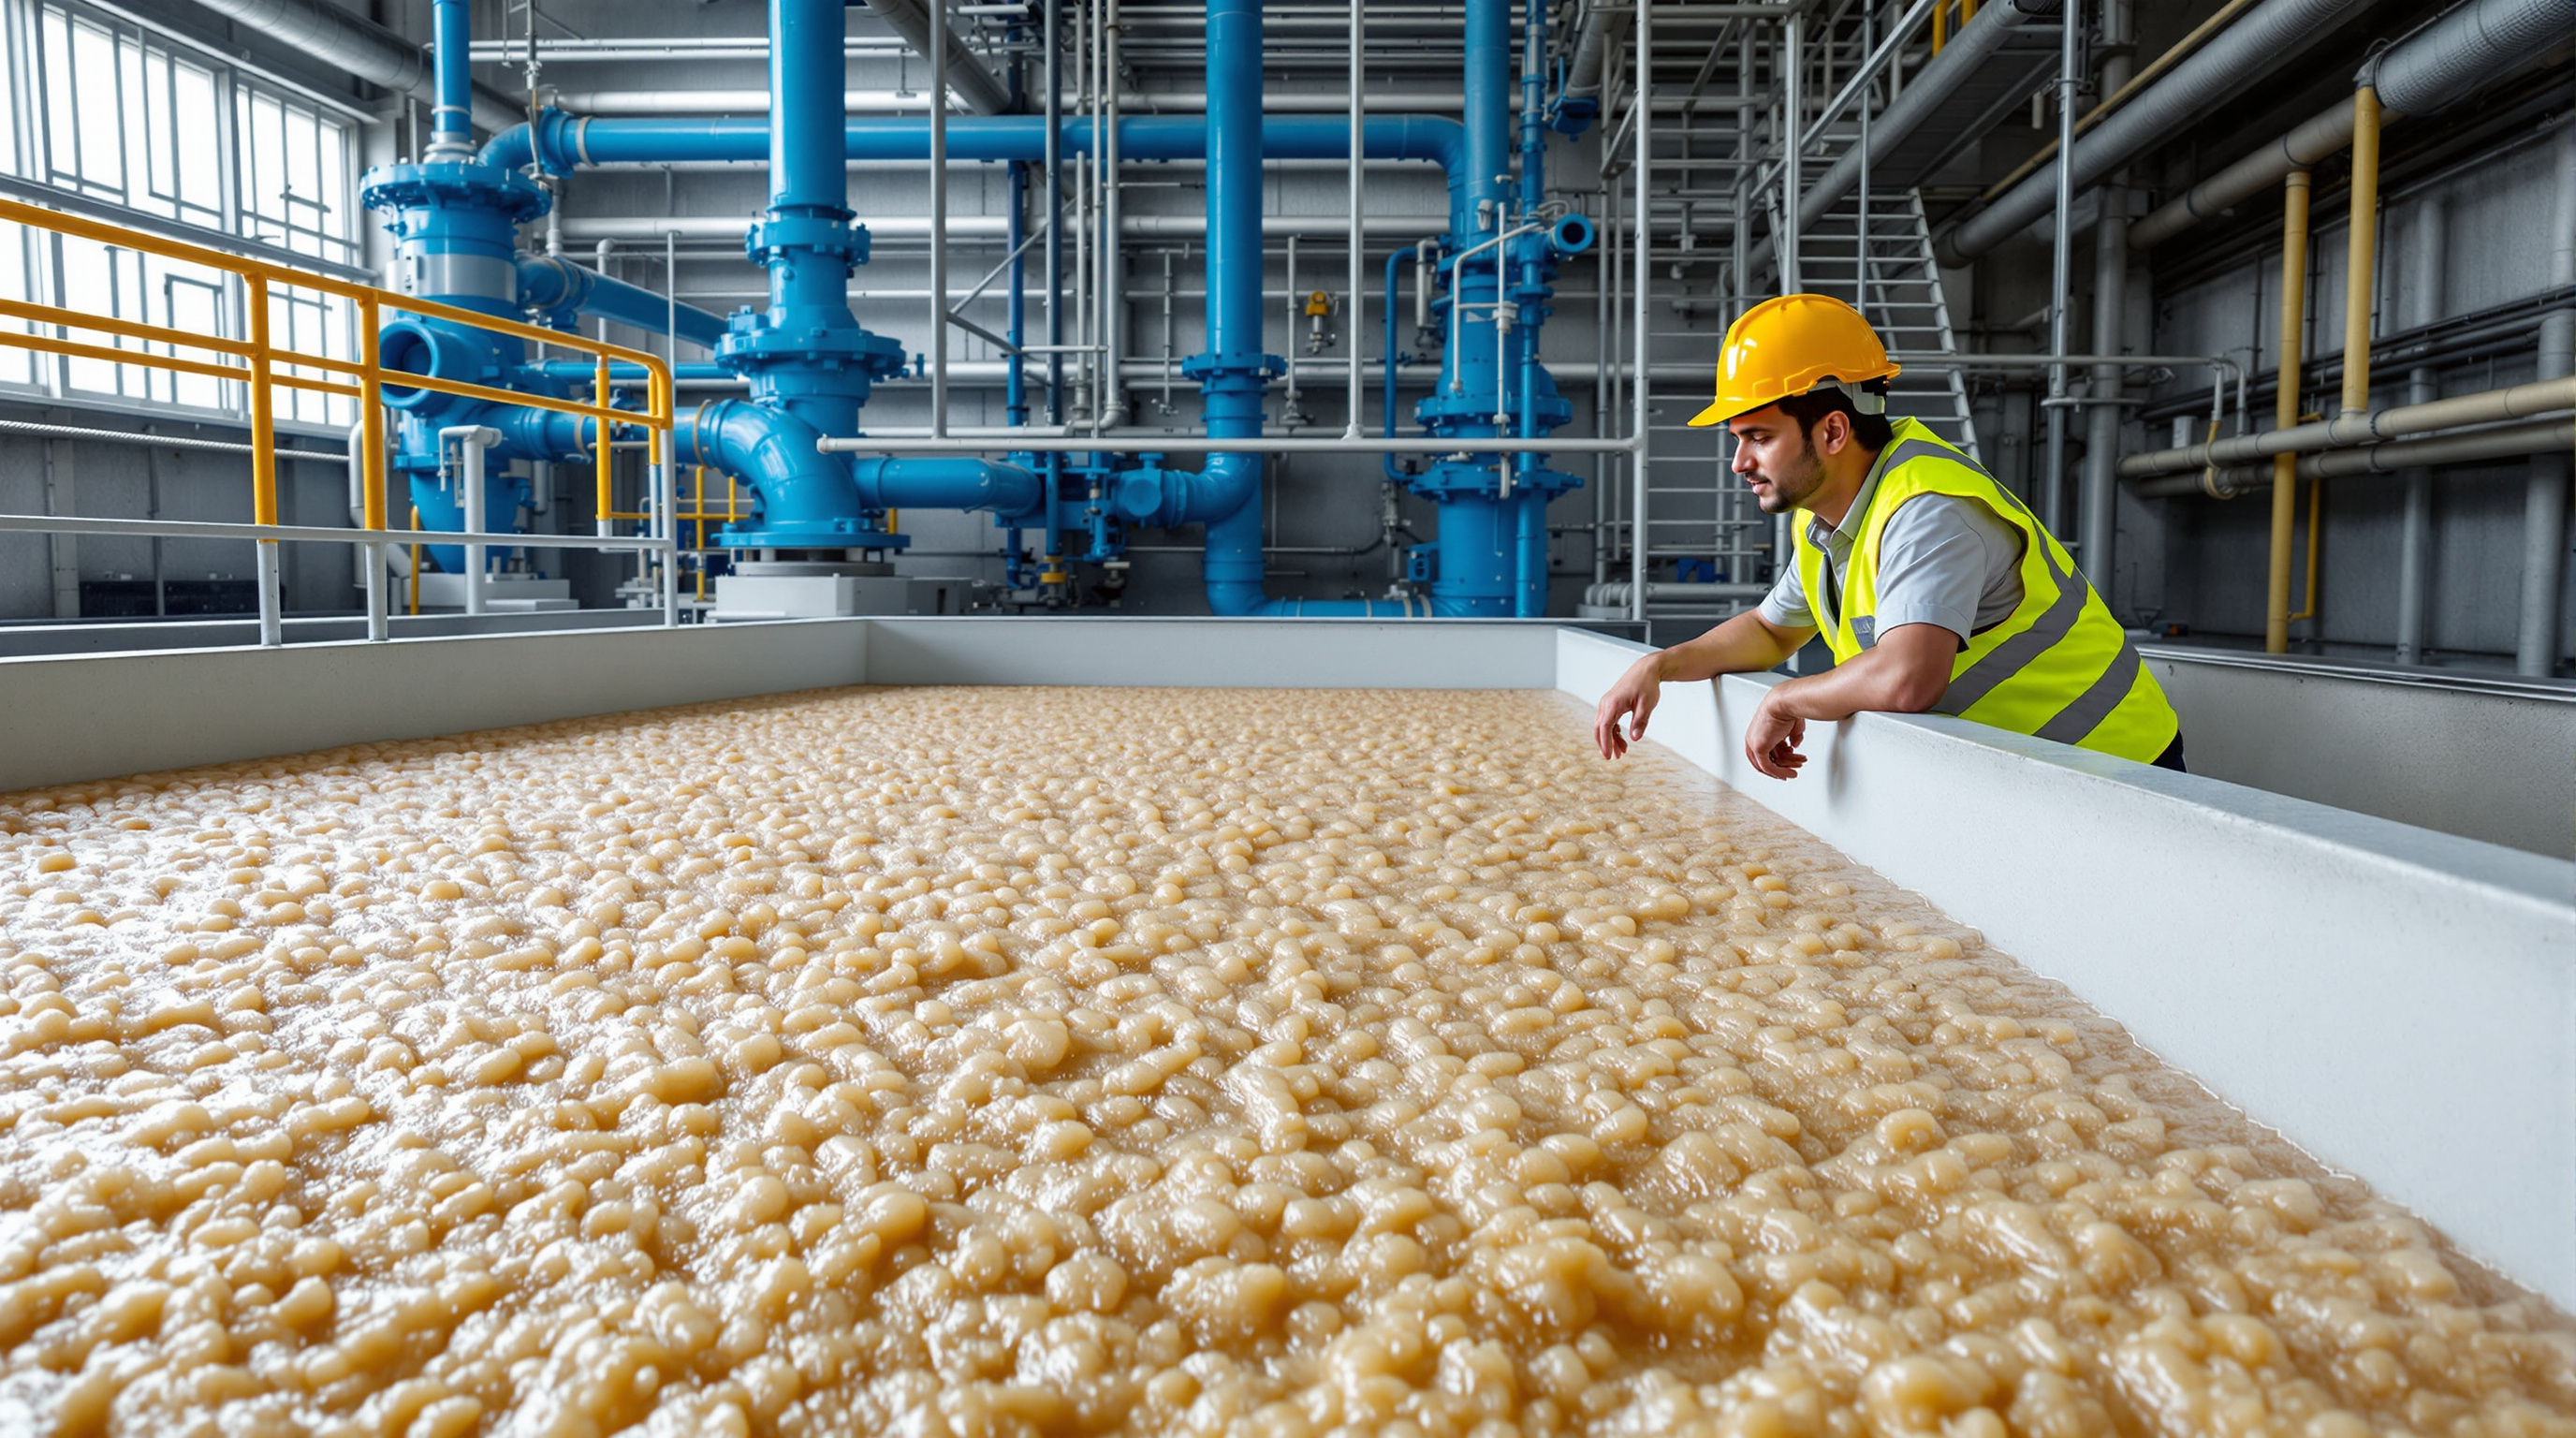
MLSS — mixed liquor suspended solids — is the concentration of the microbial sludge kept in the aeration tank, typically 2,500–4,000 mg/L in a conventional plant. A low F/M (little food per microbe) means the bugs are underfed, so they fully oxidise the waste and even start eating each other — excellent effluent, low sludge production, but a bigger tank and more air. A high F/M means the bugs are overfed: fast growth, more sludge, and a real risk of poor settling and filamentous bulging in the clarifier. F/M is the lever operators actually pull day to day, by wasting or retaining sludge to hold MLSS where they want it.
Typical ranges by process
Different technologies are simply different bargains between OLR, F/M and tank size. The higher the loading a process can tolerate, the smaller — and usually the more mechanised — the plant. Indicative design ranges for domestic sewage:
| Process | Volumetric OLR (kg BOD/m³/day) | F/M ratio (kg BOD/kg MLSS/day) | Character |
|---|---|---|---|
| Extended aeration (low-rate ASP) | 0.15 – 0.40 | 0.05 – 0.15 | Large tank, superb effluent, low sludge |
| Conventional Activated Sludge Process | 0.30 – 0.60 | 0.20 – 0.50 | The classic balance |
| SBR | 0.20 – 0.50 | 0.10 – 0.30 | Batch cycles, compact, tolerant of surges |
| MBBR | 1.0 – 4.0 (per m³ of media zone) | n/a — biofilm, not MLSS | High load in small footprint |
| MBR | 1.0 – 3.0 | 0.05 – 0.30 (very high MLSS) | Smallest footprint, best effluent, highest cost |
A few things to read out of this table:
- MBBR and MBR carry far higher volumetric loads because they hold biomass as a fixed film on plastic carriers or at very high MLSS behind a membrane, rather than as free-floating flocs limited to ~4,000 mg/L. That is precisely why they win where land is scarce.
- F/M is meaningless for pure biofilm processes like MBBR — there is no suspended MLSS to divide by. Loading there is expressed per unit of media surface area or media-zone volume instead.
- Extended aeration deliberately runs starved. Its very low F/M is why it produces such stable, well-nitrified effluent and so little surplus sludge — at the cost of the biggest tank on the list. If you are weighing technologies, how an STP works walks through the trade-offs in plain terms.
How loading drives tank size and effluent quality
This is where organic loading stops being an abstraction and starts costing money. Work an example. Take a residential development generating 400 KLD of sewage at a typical Indian domestic strength of 300 mg/L BOD:
- Organic load = 400 × 300 ÷ 1000 = 120 kg BOD/day
- Design for conventional ASP at an OLR of 0.4 kg BOD/m³/day
- Required aeration volume = 120 ÷ 0.4 = 300 m³
Now suppose the flow stays the same but the sewage is stronger — a plant with heavy kitchen and mess loads pushing BOD to 450 mg/L. The load jumps to 180 kg/day, and at the same OLR the aeration tank must grow to 450 m³. Same litres, fifty percent more concrete — entirely because of organic load. This is why sizing on flow alone is dangerous, and why the organic loading calculator asks for both flow and BOD before it returns a load, an OLR and an implied tank volume.
The same load, pushed too hard, wrecks effluent quality rather than demanding more volume:
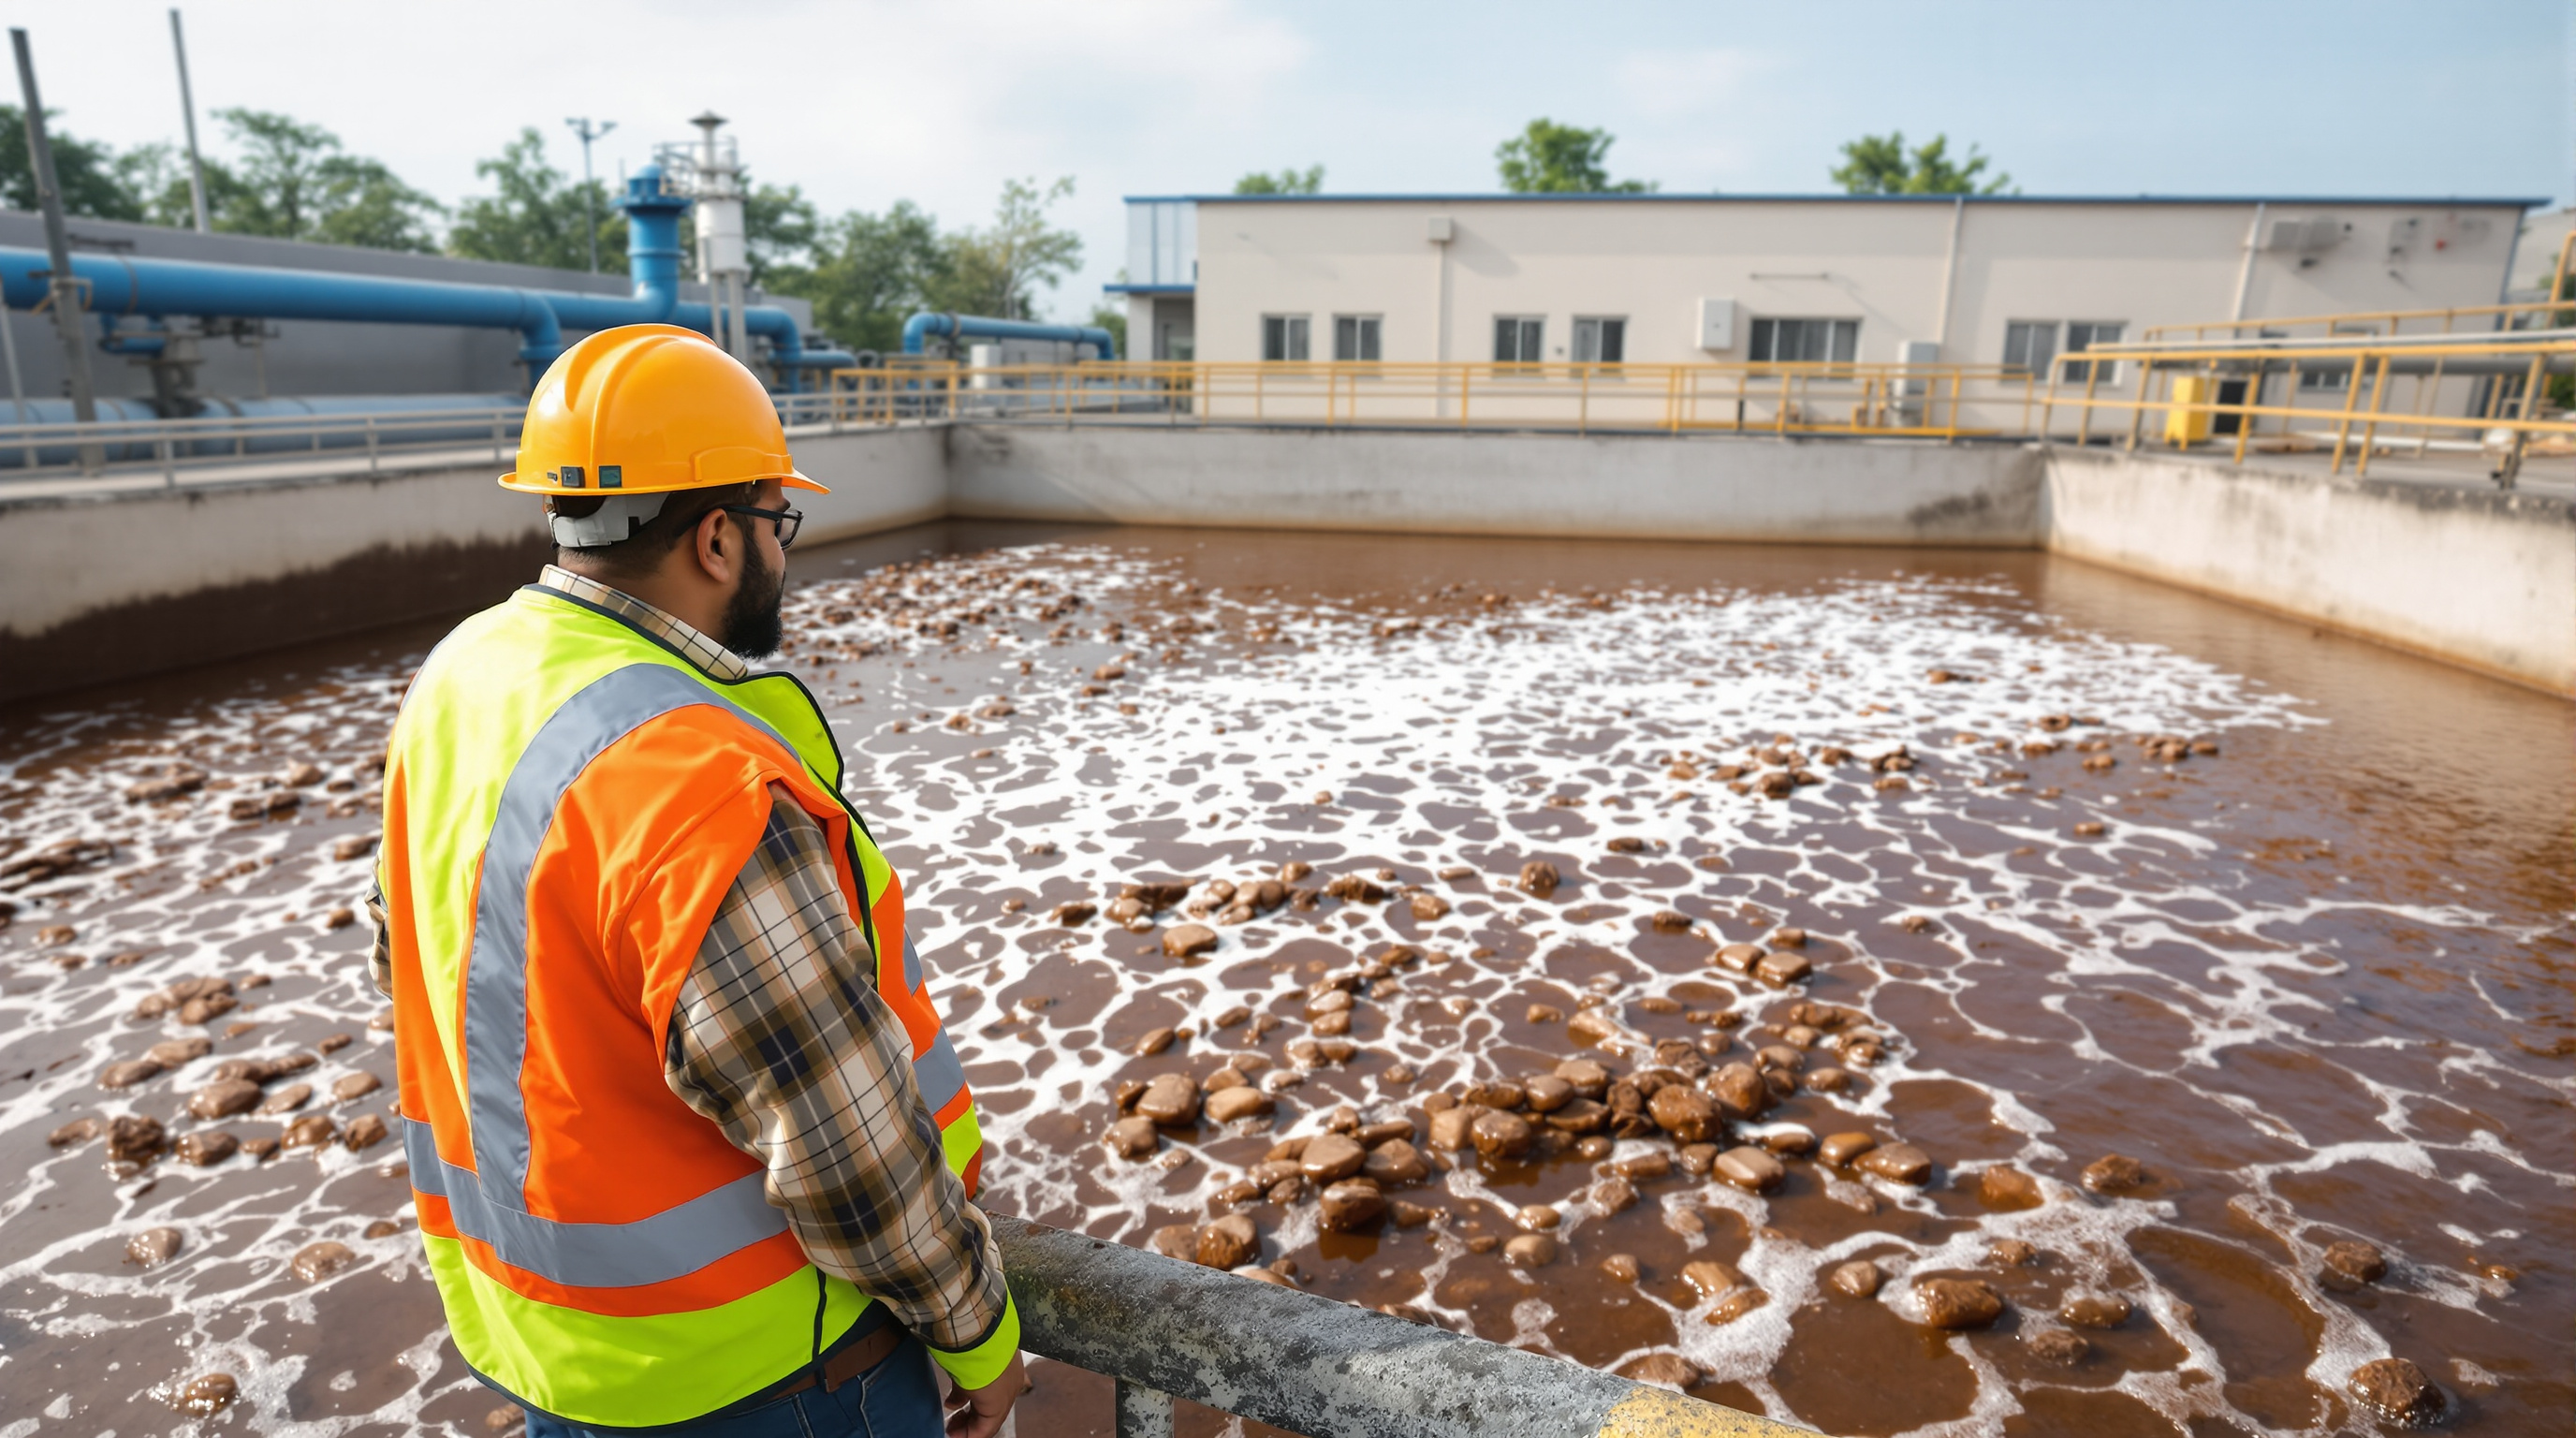
- Overloaded (OLR too high / F/M too high): microbes cannot oxidise all the incoming BOD, so it passes through. Dissolved oxygen crashes, the sludge goes septic and bulks, the clarifier carries over solids, and BOD/TSS in the final water breach the norm.
- Underloaded (OLR too low / F/M too low): rarely a compliance problem, but wasteful — you are aerating and maintaining a tank far larger than the load justifies, burning power for effluent that is cleaner than required.
Good design lands in the middle of the process band, then leaves headroom for the peaks. Which brings up two loads, not one.
Average versus peak load — design for both
The 120 kg/day above is an average. Real sewage arrives in waves: a morning shower peak, a lunchtime kitchen surge, near-nothing at 3 a.m. If the aeration system is sized only for the daily average, it will choke during the peak and the effluent will spike exactly when the plant is busiest. Two defences matter:
- An equalisation tank upstream buffers both flow and load, flattening the surges into something the biology can handle steadily — arguably the most underrated tank in the plant.
- The aeration design and blower capacity are set against the peak organic load, not the average, so oxygen supply never falls behind demand. Peak flow design covers the flow side of this same idea.
Note too that organic loading and hydraulic loading are different constraints that must both be satisfied. A tank big enough for the organic load might still give the water too little contact time, or vice versa; the binding one wins. Check the water-time side with the hydraulic retention time calculator.
A note on industrial effluent
Everything here assumes domestic sewage — the 250–400 mg/L BOD range of homes, offices and institutions. Industrial streams are a different world: a dairy, brewery or food-processing effluent can run at several thousand mg/L BOD, ten to twenty times domestic strength. At those loads the arithmetic is the same but the answer is not a bigger STP — it is a purpose-built ETP, often with an anaerobic first stage like a UASB reactor to knock down the bulk of the organic load before any aerobic polishing. Never size a domestic-STP process for an industrial organic load; the STPs vs ETPs guide explains why the two are not interchangeable.
The bottom line
Organic loading is the honest measure of how hard an STP has to work. Flow tells you how much water to move; organic load tells you how much pollution the microbes must destroy, and from that single kilograms-per-day figure flow the OLR that sizes your tank, the F/M that your operators manage, and the effluent quality your consent depends on. Get the load right and everything downstream has a chance; get it wrong and no amount of blowers or chemicals will rescue the numbers.
When you are ready to put figures to your own project, run the organic loading calculator to turn flow and BOD into a design load, then step across to the wider Sewage Treatment Plants guide library and the STP capacity calculator to size the plant around it.
Export this guide
Related Guides — Deep-dive reading
Understanding Hydraulic Retention Time (HRT) in STPs: The Complete Guide
What hydraulic retention time really means, how it sets the size of your reactor and the quality of your treated water, typical HRT figures for ASP, MBBR, SBR and UASB, and why HRT and SRT are two different clocks you must not confuse.
Sewage Treatment PlantsAeration Tank: The Biological Heart of an STP
The tank where blowers push oxygen into billions of microbes that eat the sewage's organic load — how it works, what DO, MLSS, F/M and HRT mean, and why it quietly runs up the biggest electricity bill in the plant.
Sewage Treatment PlantsBiological Culture Management in an STP: The Heart of Good O&M
The microbes in your aeration tank do the actual work of cleaning sewage. Keep them healthy — the right MLSS, food, oxygen and nutrients — and everything else falls into place. Here is how operators manage the living culture, diagnose bulking and foaming, and recover after a crash.
Sewage Treatment PlantsRelated Tools — Try Free
Hydraulic Retention Time (HRT) Calculator
Compute a reactor or tank's hydraulic retention time from its volume and daily flow, and benchmark it against recommended ASP, MBBR and SBR ranges.
STP CalculatorPopulation Equivalent (PE) Calculator
Convert an organic pollution load into Population Equivalent from flow and BOD concentration — the BOD load in kg/day and equivalent number of people.
STP CalculatorSewage Generation Calculator
Estimate the daily sewage a building generates and its peak flow in KLD from occupancy, LPCD, sewage return factor and peak factor.
STP Calculator