
Dairy Industry Wastewater Treatment: ETP Design, UASB Biogas & Reuse Guide
Why milk processing produces some of the most oxygen-hungry effluent in the food sector, and how a DAF + UASB + aerobic treatment train tames its BOD, COD and fats — with biogas recovery and water reuse built in.
A dairy plant looks clean. Gleaming stainless steel, white tiles, the smell of pasteurised milk. But behind that hygiene is one of the most polluting waste streams in the entire food industry. Every litre of milk that spills, every batch of whey drained, every wash-down of a pasteuriser sends a flood of dissolved sugar, fat and protein into the drain. Left untreated, that effluent would strip the oxygen out of any river it reached within hours.
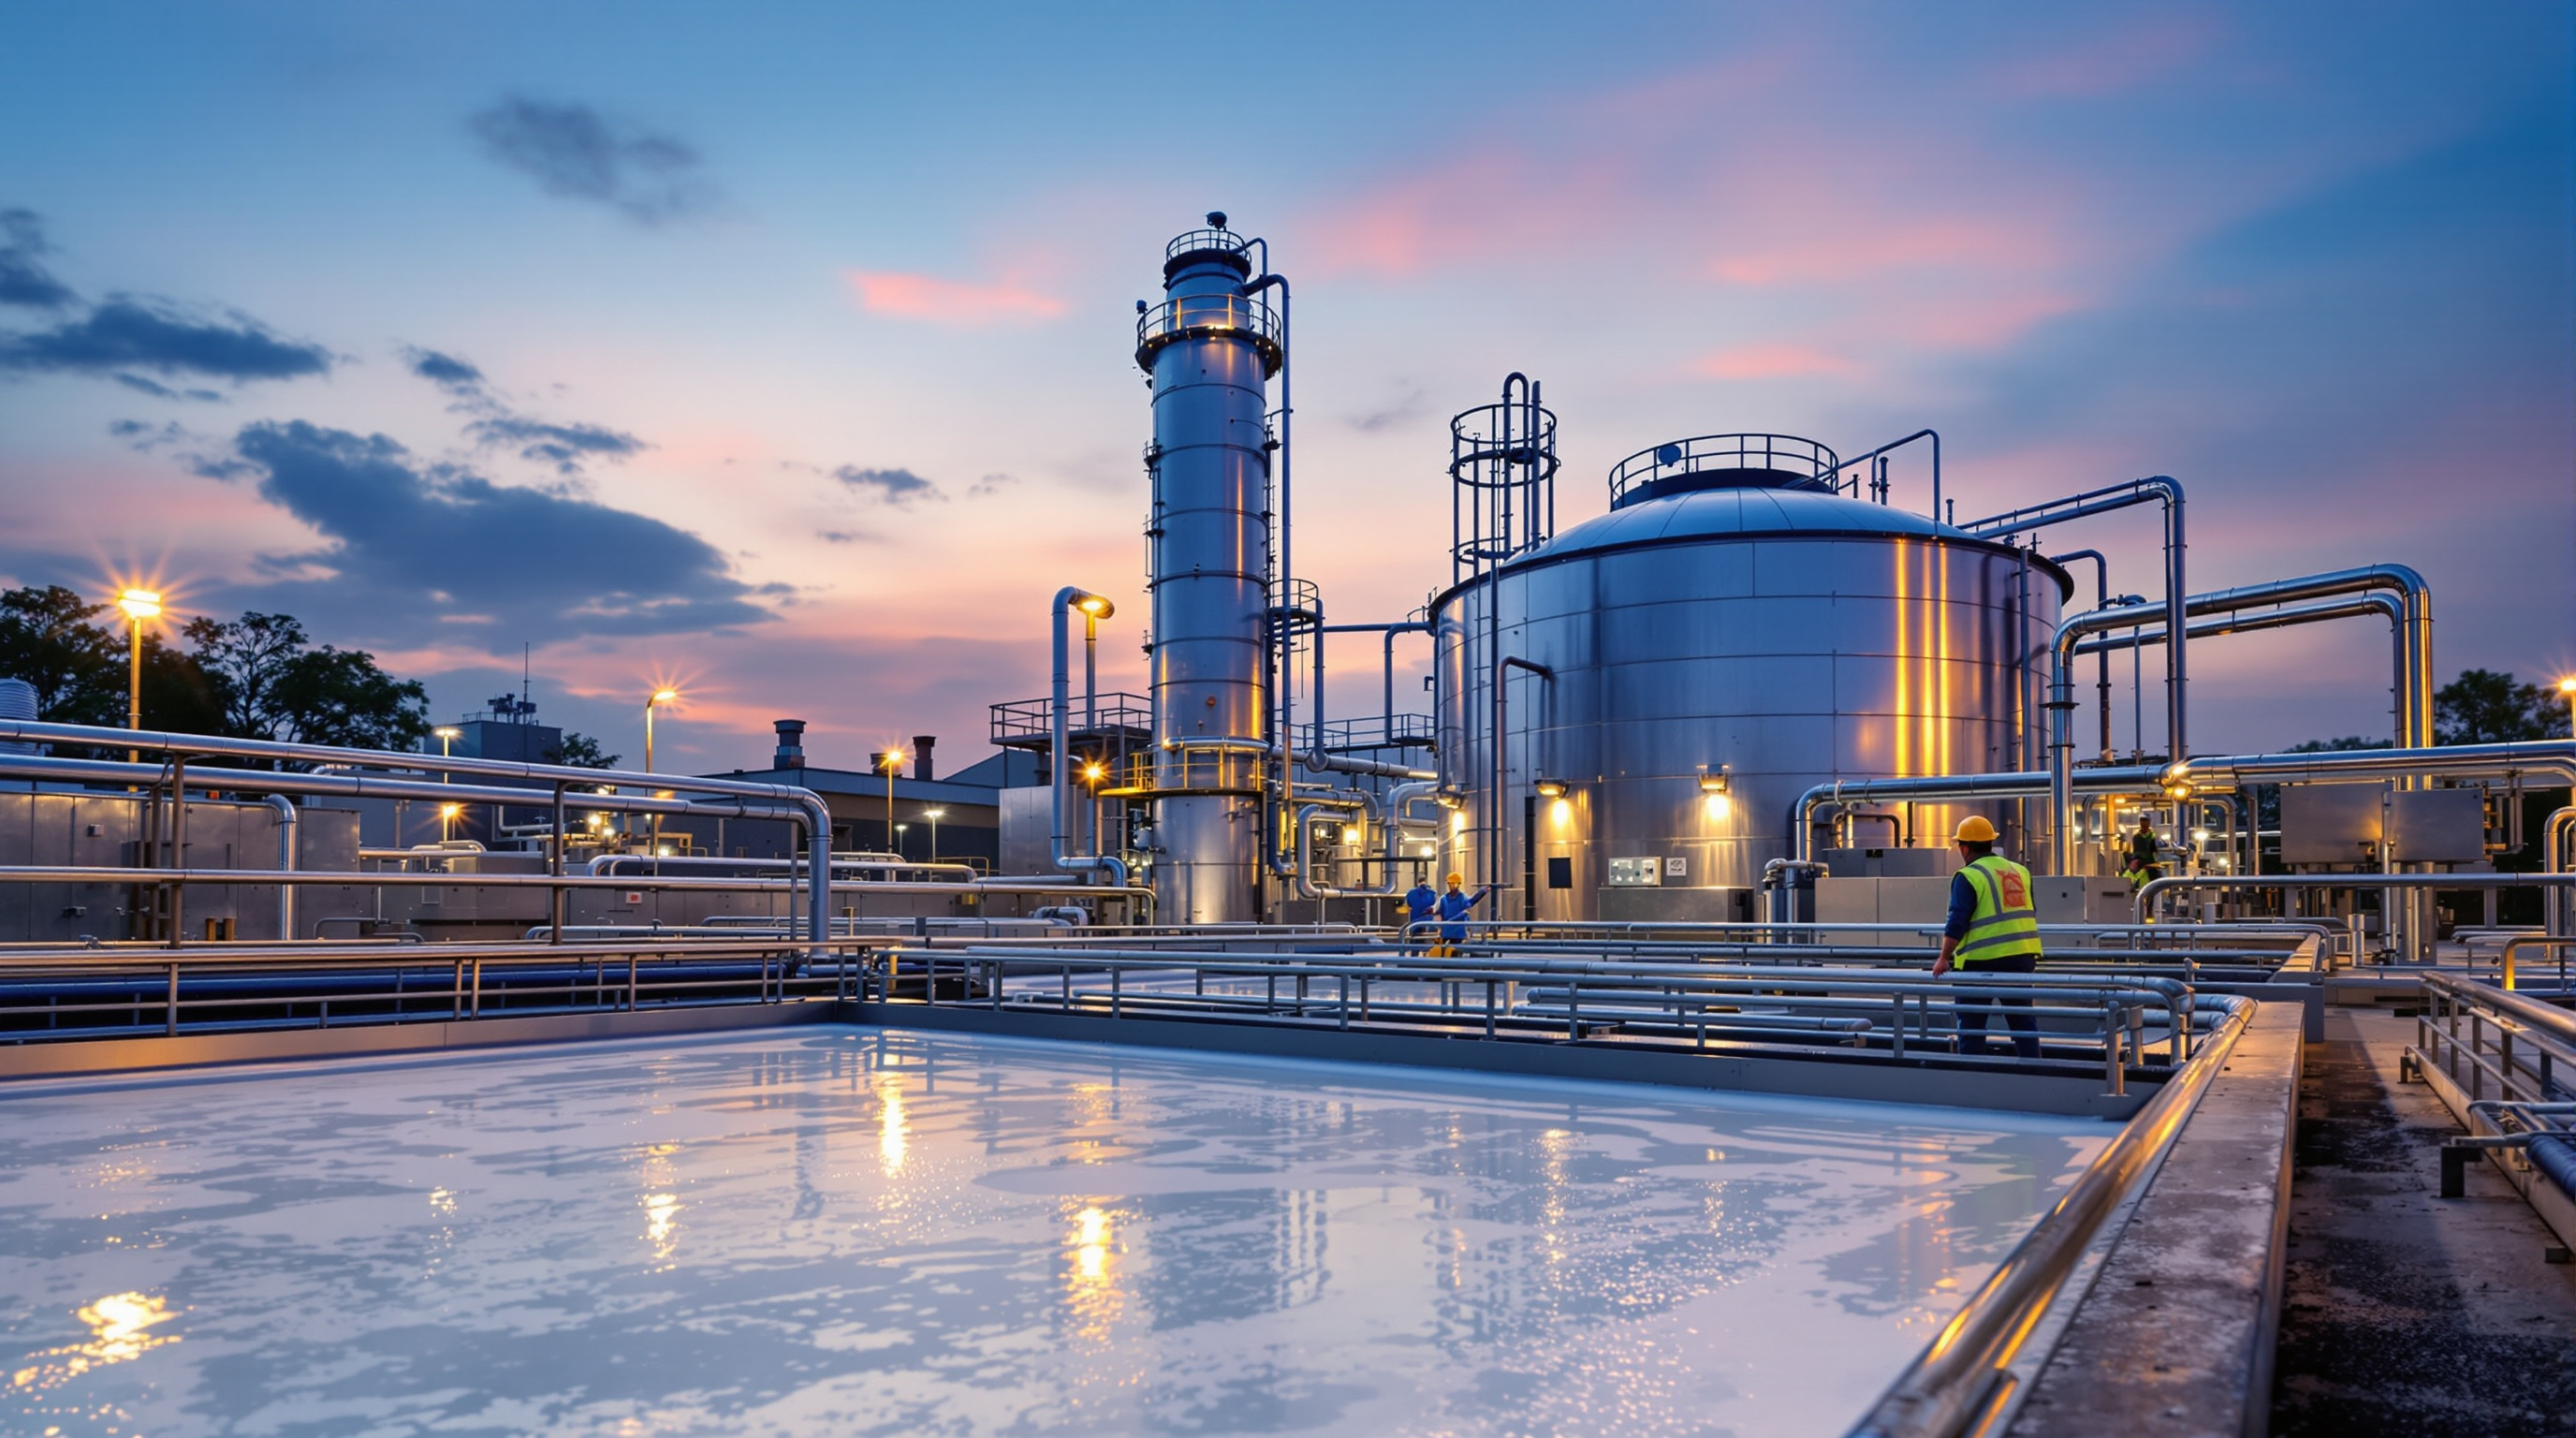
This is why a dairy does not run an ordinary sewage treatment plant. It runs an Effluent Treatment Plant (ETP) built for a very specific, very concentrated enemy. This guide explains what makes dairy industry wastewater treatment so demanding, and how the standard Indian solution — a DAF + UASB + aerobic train with biogas recovery and water reuse — brings it under control.
A well-run municipal STP fights sewage with a BOD around 250–350 mg/L. Raw dairy effluent can arrive at 2,000–6,000 mg/L — ten to twenty times stronger. You are not treating dirty water; you are treating a dilute, spoiling food.
Why dairy effluent is a different animal
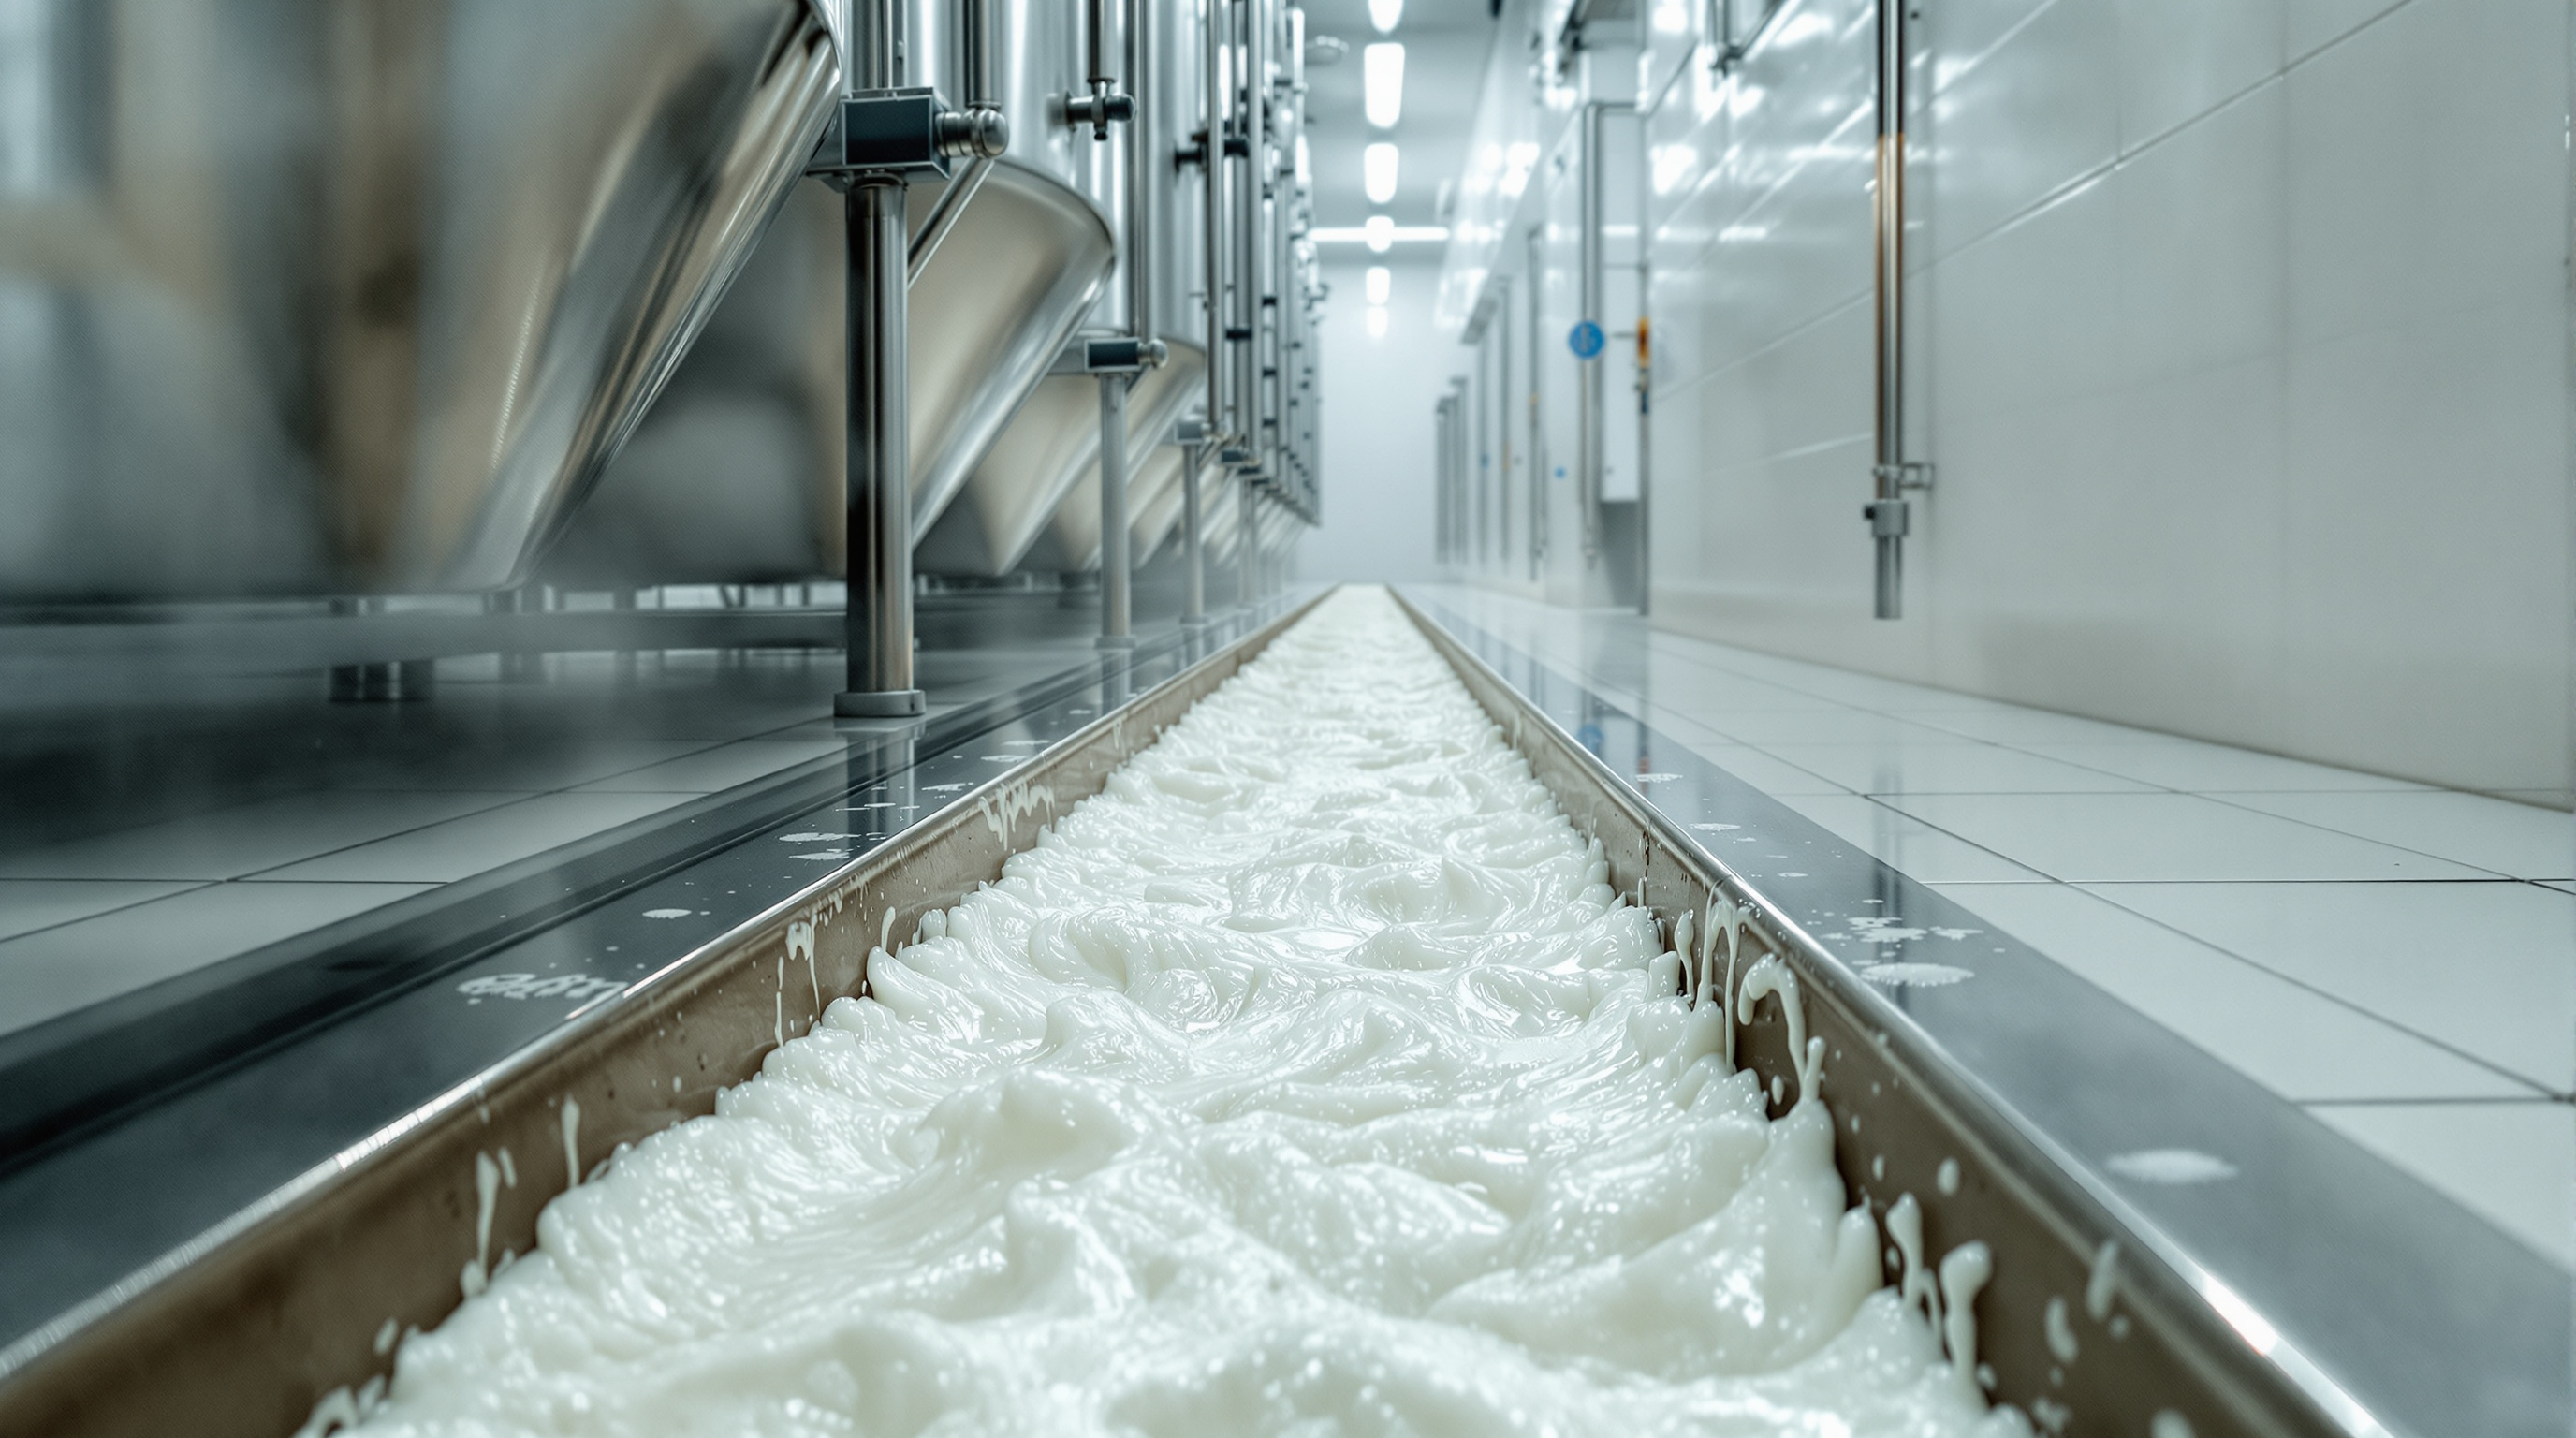
The pollution in dairy wastewater is not dirt — it is food, which is precisely the problem. Milk is roughly equal parts fat, sugar (lactose) and protein, and all three are highly biodegradable. When they hit water, microbes attack them so eagerly that the oxygen demand goes through the roof.
The waste stream comes from a handful of predictable sources:
- Milk and product losses — spillage, tank drainings, returned product, and the rinse of "first milk / last milk" from every pipe changeover.
- Whey and permeate — the single strongest stream in a cheese or paneer plant; whey alone can carry a COD above 60,000 mg/L.
- CIP (Cleaning-In-Place) washwater — the caustic soda, nitric/phosphoric acid and sanitiser used to clean tanks and lines. This is what swings the pH violently between 3 and 12 through the day.
- Fats, Oils and Grease (FOG) — butterfat, ghee-line residues and cream that float and coat everything downstream if not removed early.
If you are still deciding whether your project needs an STP or an ETP, STPs vs ETPs draws the line clearly — and dairy falls firmly on the ETP side. For a refresher on the pollution parameters themselves, BOD, COD, TSS and pH explained is the companion read.
Typical raw dairy effluent (indicative)
| Parameter | Raw dairy effluent | Typical discharge norm (CPCB/SPCB, directional) |
|---|---|---|
| BOD | 1,200–5,000 mg/L | ≤ 30 mg/L (on land / inland surface) |
| COD | 2,000–8,000 mg/L | ≤ 250 mg/L |
| TSS | 500–2,500 mg/L | ≤ 100 mg/L |
| FOG (Oil & Grease) | 100–1,000 mg/L | ≤ 10 mg/L |
| pH | 3.0–12.0 (swinging) | 5.5–9.0 |
| Flow | often 1–3 KL per KL of milk processed | — |
The exact limits depend on your State Pollution Control Board consent and whether you discharge to land, sewer or surface water — always design to your specific consent conditions, not a generic table.
The treatment train, stage by stage
The genius of dairy treatment is sequencing: knock out the fats first, let anaerobic microbes eat the bulk of the load cheaply (and make gas doing it), then polish aerobically to meet norms. Each stage is sized for what the previous one leaves behind.
Stage 1 — Screening, oil removal and equalisation
Coarse screens catch curd lumps, packaging and plastic. The flow then passes an oil and grease trap to skim the easy floating fat. Critically, everything collects in an equalisation tank with mixing and often air sparging — this is non-negotiable for dairy. It buffers the shock of a sudden whey dump, evens out the flow, and lets you neutralise the pH to the near-neutral band the biology needs. Size it generously; the equalization tank guide explains why under-sizing this tank sinks the whole plant. You can pressure-test your buffer volume with the hydraulic retention time calculator.
Stage 2 — DAF (Dissolved Air Flotation)
This is the fat-killer. In a DAF unit, water is supersaturated with air under pressure, then released into the flotation cell. Millions of microbubbles attach to fat globules and suspended solids and float them to the surface as a thick float, which a skimmer rakes off. A coagulant and flocculant dose (alum/PAC + polymer) sharpens the separation. A good DAF removes the bulk of FOG and 30–50% of the COD before the biology ever sees it — protecting the downstream reactors from being smothered by grease.
Stage 3 — UASB (anaerobic digestion + biogas)
Here is where dairy treatment earns its keep. The Upflow Anaerobic Sludge Blanket (UASB) reactor sends the effluent upward through a dense blanket of anaerobic granules that digest the dissolved sugars and proteins without oxygen. Because dairy waste is so biodegradable, a UASB can strip 70–85% of the incoming COD — and it does so while producing biogas (methane + CO₂) instead of consuming electricity for aeration.
That biogas is a real asset: it is typically scrubbed and burned in a boiler to raise process steam or hot water, offsetting a chunk of the plant's fuel bill. The UASB deep-dive covers granule health, upflow velocity and the gas–liquid–solid separator in detail. Because the anaerobic stage carries most of the pollution load, size it against your true organic load, not just flow — the organic loading calculator is the right tool for that.
Stage 4 — Aerobic polishing
Anaerobic treatment is powerful but rarely enough on its own — the UASB effluent still carries a BOD in the low hundreds. An aerobic stage finishes the job, oxidising the residual organics down to discharge quality. Depending on footprint and budget this is an extended-aeration Activated Sludge Process, an MBBR where space is tight, or an SBR for batch-heavy plants. The aeration tank and a following clarifier do the familiar eat-and-settle work here.
Stage 5 — Tertiary polishing and reuse
Clarified water passes a pressure sand filter and activated carbon filter to remove residual turbidity, then disinfection. Many modern dairies push further — an ultrafiltration or RO stage — so the water is clean enough to reuse in cooling towers, floor washing, gardening and non-product cleaning. Where a plant targets Zero Liquid Discharge, the RO reject goes to an evaporator and the water loop closes almost completely.
Sludge, gas and the by-product economy
Two by-products leave the plant, and both can be handled smartly:
- Biogas from the UASB — captured, scrubbed and fired in the boiler. On a large dairy this can offset a meaningful share of thermal fuel and improves the plant's carbon story.
- Sludge — the floated DAF fat and the excess biological sludge are thickened and de-watered on drying beds or a filter press. DAF skimmings are fatty and can sometimes be co-digested. Estimate the volumes early with the sludge generation calculator so you size drying beds and disposal contracts correctly.
Designing it for a real plant
A few hard-won principles separate a dairy ETP that meets consent from one that chronically fails:
- Over-build the equalisation and neutralisation. The single most common cause of dairy ETP upset is a slug of caustic CIP water or raw whey hitting the biology unbuffered. Volume and pH control here protect everything downstream.
- Never let FOG reach the biology. Fat coats granules and sludge flocs, and once your UASB blanket is greased, recovery takes weeks. The DAF is not optional.
- Design on load, not just flow. Dairy flow is modest; the organic load is enormous. Two plants with identical KLD can need very different reactors. Start from a proper mass balance — the how to size an STP guide and the organic loading primer walk through the logic.
- Segregate the strong streams. Keeping concentrated whey separate for dedicated handling (or by-product recovery) is often cheaper than diluting it into the main stream and treating the lot.
For the wider family of high-strength food effluents, the food processing STP and brewery wastewater guides share much of this DNA — high BOD, high sugar, anaerobic-first thinking.
The bottom line
Dairy wastewater is deceptively dangerous: clean-looking, but carrying an oxygen demand that dwarfs domestic sewage. The answer is not a bigger STP but a purpose-built ETP that respects the chemistry — skim the fat first with DAF, let a UASB eat the bulk of the load anaerobically while making biogas, then polish aerobically and filter for reuse. Done right, a dairy ETP turns a compliance headache into a genuine asset: it meets discharge norms, recovers energy as gas, and hands back most of the water for the plant to use again. Start every design from the load, not the label on the tank — and buffer generously before you ever reach the biology.
To go deeper on the individual processes, browse the full Sewage & Effluent Treatment guide library.
Export this guide
Related Guides — Deep-dive reading
Upflow Anaerobic Sludge Blanket (UASB): Anaerobic Sewage Treatment Explained
The no-oxygen reactor where sewage flows up through a blanket of granular sludge, destroying pollution while producing biogas and using almost no energy — how the sludge blanket and gas-solid separator work, why Indian municipal STPs favour it, and why it always needs an aerobic polishing step.
Sewage Treatment PlantsPharmaceutical Wastewater Treatment: Why It Needs an ETP, Not an STP
Pharma effluent carries high COD, toxic and refractory compounds, swinging pH and traces of active drug ingredients — a load that overwhelms a domestic STP. Here is what makes it so hard to treat, and the ETP train engineers build to handle it in India.
Sewage Treatment PlantsSTP for Restaurants & Kitchens: Grease, Effluent Treatment & Compliance Guide
Restaurant wastewater is a different animal — thick with fats, oils and grease and a heavy organic load. This guide explains how to trap the grease, whether you need a full STP or just pretreatment before the sewer, and how a standalone eatery stays compliant in India.
Sewage Treatment PlantsRelated Tools — Try Free
Hydraulic Retention Time (HRT) Calculator
Compute a reactor or tank's hydraulic retention time from its volume and daily flow, and benchmark it against recommended ASP, MBBR and SBR ranges.
STP CalculatorFilter Sizing Calculator (PSF/ACF)
Size a pressure sand or activated carbon filter from flow and filtration rate to get vessel diameter, filter area and hourly design flow.
STP CalculatorHealing View Impact Calculator
Evidence-Based Design dashboard quantifying the recovery impact of nature view + daylight factor on analgesic use, length of stay, and HCAHPS patient-experience uplift. Calibrated against Ulrich 1984 (Science), Park & Mattson 2008, and the CHD EBD evidence base.
EBD Calculator