
Heat Island Effect and Landscaping
How landscape cools cities at neighbourhood scale — the urban heat island, why India runs hotter, and the canopy, corridors, surfaces and water that bring temperatures down
The urban heat island is not a heatwave problem you can wait out — it is a permanent thermal penalty baked into how Indian cities are paved, built and stripped of vegetation, and landscape is the single most cost-effective lever planners have to claw degrees back at the neighbourhood and city scale.
This is a deliberately urban-scale guide for architects, planners, developers and RWAs. It is about the city, the colony and the street — not the single plot. Plot-level cooling (orientation, shading devices, the right shade tree at the right window) is covered in depth in Climate-Responsive Landscape Design and Shade Planning Through Trees; species selection lives in Best Trees for Indian Homes. Here we stay in the lane of the aggregate thermal behaviour of urban fabric and how landscape, deployed across whole neighbourhoods, mitigates it.
What the urban heat island effect actually is
The urban heat island (UHI) is the measurable tendency of built-up areas to run hotter than the surrounding countryside — typically 2–5 °C warmer in air temperature, and far more at the surface. It is not caused by one thing but by a stack of reinforcing mechanisms.
| Cause | Mechanism | Why Indian cities suffer |
|---|---|---|
| Impervious surfaces | Concrete, asphalt and tile replace soil and plants; rainwater runs off instead of evaporating | Rapid, dense, often unplanned paving; little permeable ground left |
| Dark, high-absorptance materials | Black asphalt and grey concrete absorb 80–95% of solar radiation and re-radiate it as heat | Bitumen roads, RCC roofs, grey paving dominate the palette |
| Lost vegetation / evapotranspiration | Plants cool air by transpiring water and shading surfaces; removing them removes a free air-conditioner | Tree cover felled for road-widening, plots, metro corridors |
| Anthropogenic (waste) heat | AC condensers, vehicles, industry and DG sets dump heat into the street | Soaring AC penetration; idling traffic; backup diesel gensets |
| Urban canyon geometry | Tall, closely spaced buildings trap radiation by multiple reflection and reduce sky view, slowing night-time cooling | Dense mid-rise and high-rise cores with narrow setbacks |
| Reduced wind / ventilation | Built mass blocks breeze paths; reduced airflow means heat is not flushed out | Walled colonies, continuous frontages, blocked wind corridors |
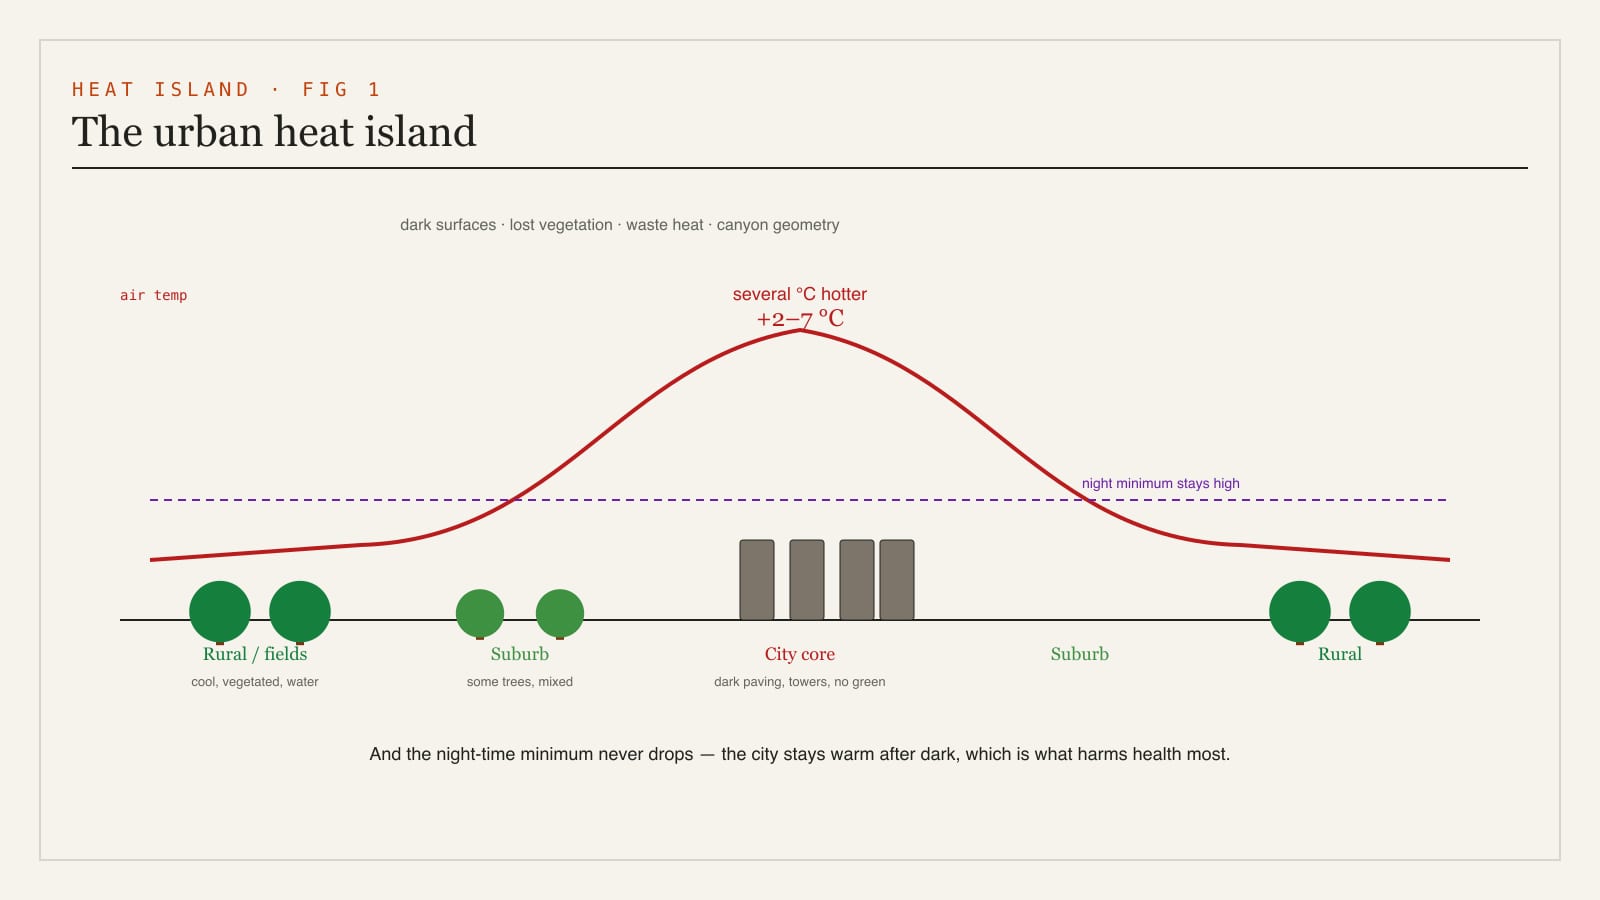
The most important and least understood feature is the night-time minimum that never drops. The UHI is usually strongest after sunset: rural land sheds its daytime heat quickly, but the urban mass — having stored heat all day in concrete and asphalt — releases it slowly through the night. The result is a higher nocturnal minimum temperature, which denies the body its recovery period and is the variable most strongly linked to heat mortality.
Surface temperature versus air temperature
Two distinct quantities are routinely confused, and conflating them produces bad design.
- Surface temperature (LST, land surface temperature) is how hot the physical material is. A dark asphalt road in a Delhi May can reach 55–65 °C; a shaded grass verge alongside it may sit at 30–35 °C. LST is measured by thermal satellite imagery (Landsat, MODIS) and thermal cameras, and it drives the heat felt underfoot and the radiant load on people and buildings.
- Air temperature (the canopy-layer UHI) is what a standard met screen at 1.5–2 m records. The air UHI is more muted than the surface UHI — typically a few degrees — but it is what IMD reports and what heatwave thresholds use.
For mitigation work, surface temperature is where landscape shows its biggest, most photogenic wins (shaded vs unshaded surfaces can differ by 15–25 °C), while air temperature is the harder, slower needle to move at scale. Both matter; report both.
Measuring the island: the rural–urban gradient
The classic UHI signature is the rural–urban gradient — a transect of temperature readings running from open countryside, through suburbs, into the dense core and out the other side. It produces the textbook profile: a cool rural plateau, a steep "cliff" at the urban edge, an undulating "plateau" across the built fabric punctuated by cool dips over parks and water bodies, and a "peak" over the densest, most paved district.
Practical measurement options for a project:
- Fixed met stations at paired rural and urban sites (gold standard, slow to install).
- Mobile traverses — a vehicle-mounted sensor driven along a transect at a fixed hour, repeated over several nights.
- Satellite thermal imagery for surface-temperature maps of a whole city — invaluable for spotting hotspots and prioritising interventions, and increasingly the basis of municipal heat-vulnerability maps.
The deliverable a planner wants is a heat-vulnerability map overlaying surface temperature, canopy cover, building density and population (especially the elderly and outdoor workers). That map tells you where to spend the landscape budget first.
Why it matters in India
India is among the most heat-exposed large economies, and the UHI converts a difficult climate into a dangerous one.
- Heatwaves and mortality. Severe heatwaves have caused thousands of deaths in recent decades; the UHI raises the baseline a city sits at, so an urban resident endures a hotter, longer, less survivable event than a rural one — and the elevated night minimum removes the recovery window.
- Heat-action plans (HAPs). Following the pioneering Ahmedabad Heat Action Plan (2013, the first in South Asia), the NDMA and IMD now coordinate HAPs across dozens of cities and states. Early warnings, cool-roof drives and public-health protocols save lives — but they are reactive. Landscape and urban greening are the structural, preventive half of the response, and HAPs increasingly name green cover as a long-term measure.
- Cooling-energy demand. Hotter cities run more air-conditioning, which raises peak electricity load, strains the grid, and — through condenser waste heat — feeds the UHI in a vicious loop. India's India Cooling Action Plan (ICAP) recognises passive and nature-based cooling as essential to bending the cooling-demand curve.
- Liveability and equity. Heat exposure is unequal: informal settlements and low-income areas tend to have the least canopy, the most exposed roofs and the fewest cool refuges. UHI mitigation is therefore also an equity intervention.
The landscape mitigation toolkit at scale
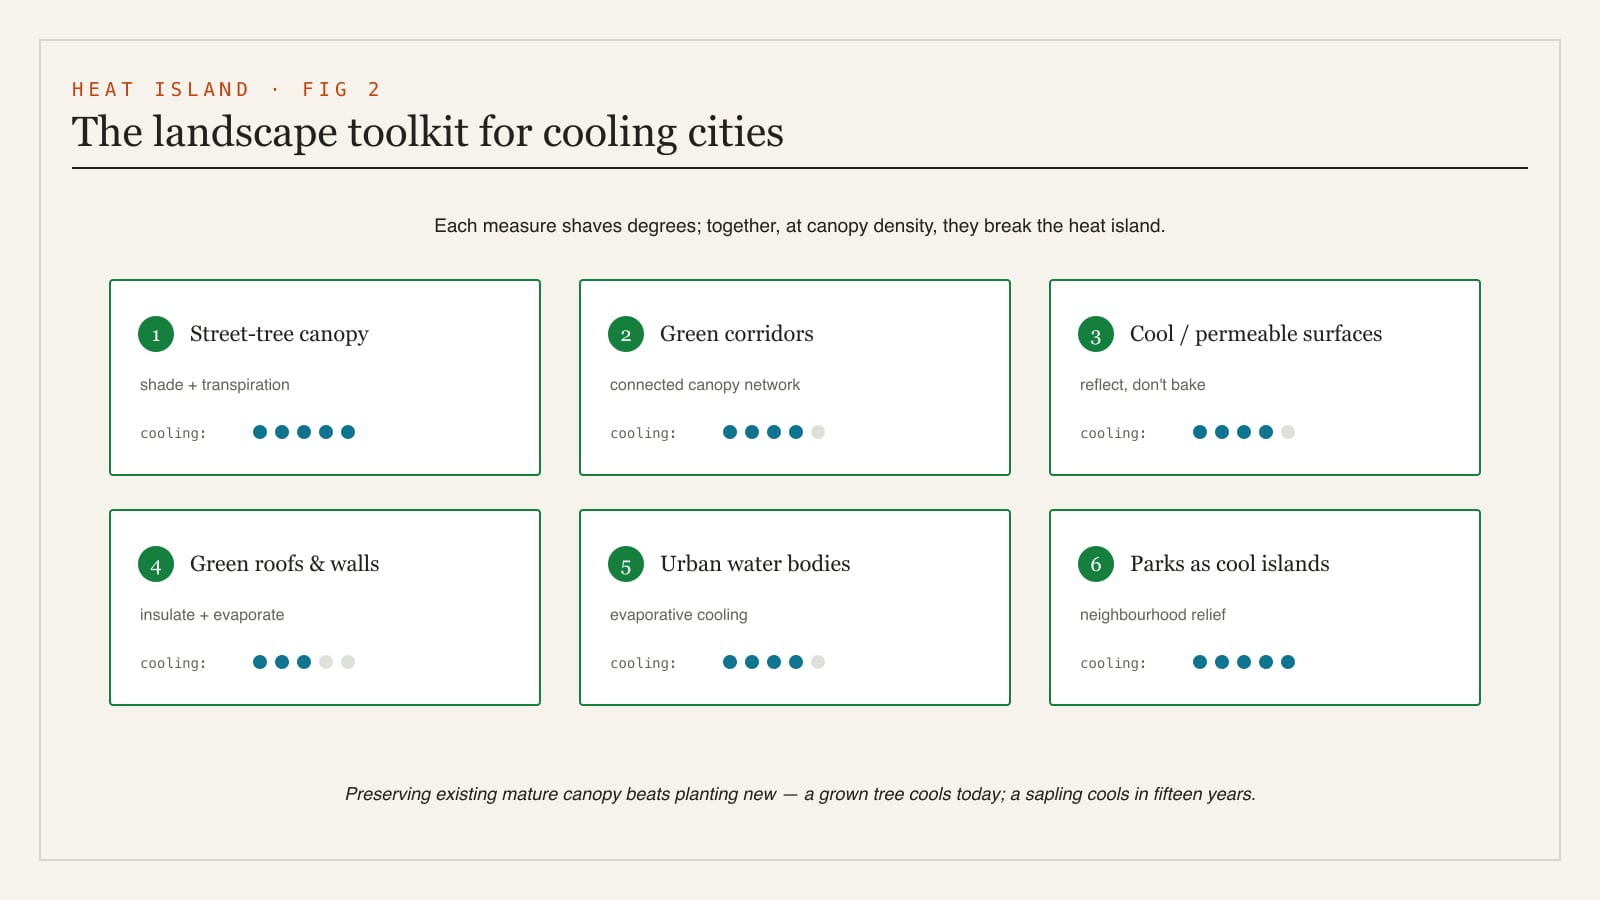
Landscape cools cities through three physical levers: shade (intercepting solar radiation before it loads a surface), evapotranspiration (plants and water converting heat into latent energy as they evaporate), and albedo (reflecting solar radiation rather than absorbing it). The toolkit below deploys those levers at neighbourhood and city scale.
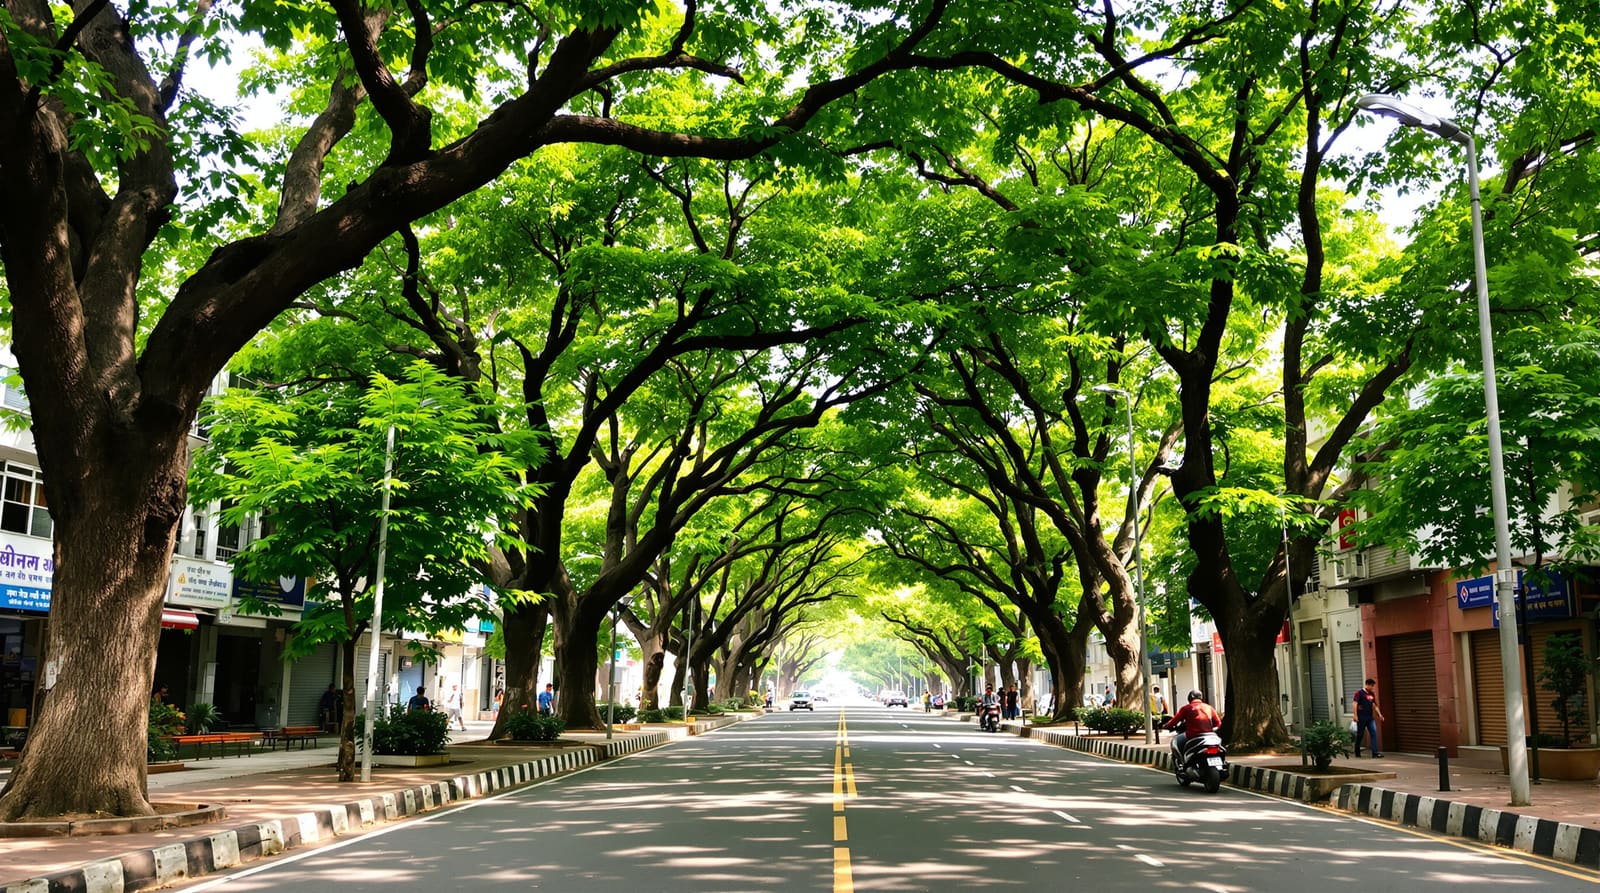
Urban tree canopy and street trees
The workhorse. A mature street-tree canopy shades pavement and walls (cutting surface temperature dramatically), transpires water, and improves walkability. The unit of planning is canopy cover percentage for a ward or city, not individual trees. Continuous canopy along a corridor compounds the effect; isolated saplings do not. Street trees need engineered conditions to survive — adequate soil volume, structural soil or root cells under paving, and protection from utility conflicts.
Green corridors and connectivity
Linked strips of green — along roads, drains, railways and rivers — do more than the sum of their parts. They form ventilation and cooling pathways that channel cooler air into the urban core and connect cool islands. This is most powerful when integrated with water as blue-green infrastructure; see Blue-Green Infrastructure and Water Sensitive Urban Design for the systems framing.
Cool / reflective and permeable surfaces
Where you cannot plant, change the material. High-albedo (light-coloured, reflective) pavements and cool roofs reflect solar radiation instead of storing it; permeable paving lets water infiltrate and evaporate, restoring some of the natural cooling that hard paving destroyed. Cool roofs are the cheapest, fastest municipal intervention available and feature in several Indian HAPs.
Green roofs and walls
On dense plots with no ground to spare, roofs and façades are the available canvas. Green roofs cut roof surface temperature sharply, insulate the floor below, and at scale lift a district's evapotranspiration. They are capital- and maintenance-intensive, so target them on large institutional and commercial roofs first.
Urban water bodies
Lakes, tanks, canals and stepwells are powerful evaporative cool islands, and their cooling reach extends downwind into the surrounding fabric. Reviving India's traditional tank-and-stepwell networks delivers heat mitigation, flood buffering and groundwater recharge together. Coordinate with Sustainable Water Management in the Landscape, Rain Gardens Explained and Rainwater Harvesting Through Landscape Design.
Parks as cool islands and preserving existing canopy
A well-vegetated, well-watered park is a measurable cool island, often several degrees cooler than its surroundings, with a "park cool island" footprint that spills into adjacent streets. Crucially, a mature tree saved is worth far more than a dozen planted — a felled 40-year canopy cannot be replaced within a planning horizon. Preservation of existing canopy is the highest-return UHI action and the easiest to lose to road-widening.
The evidence: how much cooling, and from what
The numbers vary by climate, time of day and how well the green is watered, but the literature is consistent in direction and rough magnitude.
| Measure | Typical cooling effect | Notes |
|---|---|---|
| Shaded vs unshaded paved surface | 15–25 °C lower surface temperature | The largest, most reliable effect; drives radiant comfort |
| Raising urban canopy cover (per ~10% increase) | ~0.5–1.5 °C lower local air temperature | Diminishing returns; continuous canopy outperforms scattered |
| Mature urban park (air temp inside vs surroundings) | ~1–4 °C cooler; cool footprint extends into adjacent streets | Depends on size, irrigation, tree density |
| Urban water body (downwind cooling) | ~1–3 °C, extending tens to hundreds of metres downwind | Strongest where airflow carries cooled air into the fabric |
| Cool / high-albedo roof | Roof surface 10–25 °C cooler; indoor 2–5 °C cooler | Cheapest fast win; reduces AC load and waste heat |
| Green roof | Roof surface up to ~20–30 °C cooler than bare RCC | Plus insulation and stormwater benefit; higher maintenance |
| Permeable / light pavement | Several °C lower surface temperature vs dark asphalt | Combine with infiltration for evaporative cooling |
Treat these as planning-grade ranges, not site guarantees. Two rules hold: dry, unwatered green provides shade but little evapotranspiration cooling (the water budget matters), and continuity and coverage beat dispersion — a connected canopy or a contiguous park outperforms the same green area scattered as fragments.
How a designer, planner or RWA acts
The lever you pull depends on the scale you control.
City / ULB planner
- Set a canopy-cover target by ward (many global cities aim for 30–40%) and map current cover against it to prioritise the worst, hottest, most vulnerable wards first.
- Embed UHI mitigation in development control regulations and byelaws: mandate cool roofs above a roof-area threshold, require tree-per-frontage and minimum soft-landscape ratios, protect heritage and avenue trees, and reserve blue-green corridors in the master plan.
- Fund and publish a heat-vulnerability map and tie it to the city's Heat Action Plan so greening becomes the structural complement to emergency response.
- Protect and revive water bodies and their catchments as cool-island and recharge assets.
Developer / architect (campus or large site)
- Treat the site as a microclimate: maximise pervious ground, specify cool roofs and high-albedo hardscape, retain every viable existing tree, and design a green network rather than ornamental islands.
- Provide the engineered growing conditions (soil volume, structural soil, irrigation from harvested rainwater) that let trees actually mature — the commonest failure is planting without the substrate to survive.
- Pursue green-building credits (IGBC, GRIHA) that reward heat-island reduction, raising both performance and asset value.
RWA / colony retrofit
- Audit the colony's hot surfaces and bare verges; you usually have more plantable margin than you think.
- Prioritise: (1) save mature trees, (2) close gaps in the avenue canopy for continuous shade, (3) cool-paint society and tower roofs, (4) shade and de-pave parking and play areas, (5) revive any neighbourhood tank or pond.
- Coordinate species and watering with the climate-zone framework in Climate-Responsive Landscape Design and irrigate from harvested rainwater so the canopy actually transpires.
India in practice
- Ahmedabad — South Asia's first Heat Action Plan (2013), since scaled nationally; its cool-roofs programme is a model of low-cost surface-albedo intervention in low-income housing.
- Bengaluru and Hyderabad — satellite studies repeatedly show large surface-temperature contrasts between dense, paved cores and vegetated zones; the steady loss of canopy and lakes to development is a documented driver of rising urban heat.
- Chennai and other tank cities — eri (tank) revival programmes restore historic water bodies for combined flood, recharge and cooling benefit.
- Delhi NCR — the Ridge and large parks act as measurable cool islands within an otherwise hot, paved expanse, illustrating the park-cool-island effect at city scale.
The common thread: the cities cooling effectively are the ones treating canopy, water and reflective surfaces as public infrastructure — planned, budgeted, protected and maintained — not as decorative afterthoughts.
References & further reading
- US EPA, Reducing Urban Heat Islands: Compendium of Strategies — the standard technical reference on trees, cool roofs, cool pavements and green roofs (mechanisms transfer directly to Indian practice).
- National Disaster Management Authority (NDMA), India — Guidelines for Preparation of Action Plan: Prevention and Management of Heat Wave, and the Ahmedabad Heat Action Plan.
- India Cooling Action Plan (ICAP), Ministry of Environment, Forest and Climate Change — passive cooling and nature-based measures.
- TERI and Centre for Science and Environment (CSE) — research and reports on urban heat, green cover loss and water-body revival in Indian cities.
- IGBC and GRIHA rating systems — heat-island-reduction credits for sites and buildings.
- Studio Matrx companion guides: Blue-Green Infrastructure, Water Sensitive Urban Design, Climate-Responsive Landscape Design, Shade Planning Through Trees, Best Trees for Indian Homes, Biophilic Landscape Design.
Export this guide
Related Guides — Deep-dive reading
How Buildings Can Give Back: Biodiversity and Environmental Health
How an Indian home and its plot can actively improve the ecology and environment around it, not just reduce harm
SustainabilityDesigning a Naturally Energy-Efficient Indian Home
Comfort first, gadgets last — passive design, orientation, insulation, ventilation and the climate wisdom that cuts Indian energy bills
SustainabilityThe Cool Roof Guide
The reflective roof that bounces the sun's heat back to the sky — one of the cheapest, highest-impact upgrades for a hot Indian home. What makes a roof cool (solar reflectance and thermal emittance, combined as SRI), the options from white paint to china mosaic, the temperature drops you can expect, the fast payback, and how a cool roof fits alongside insulation and green roofs. Plain language, India-grounded.
RoofingRelated Tools — Try Free
Cross-Ventilation Analyzer
Estimate airflow and air changes per hour (ACH) from room size, window areas, layout, and local wind — with NBC 2016 Part 8 compliance check.
Ventilation CalculatorRainwater Tank Sizer
How big should your rainwater tank be? Computes annual harvest, recommended tank capacity in litres, water-bill savings, and payback — for 10 Indian cities.
RWH CalculatorGarden Planning Toolkit
Get a tailored garden plan — planting layers, Indian species, features and a checklist — from your climate, space, sun and goals.
Planner