
Crime-Risk Mapping for Buildings: A Method for Indian Sites
A systematic, analytical way to map security risk across a building and its grounds — an asset-threat-vulnerability model applied zone by zone, a likelihood-x-impact risk register, and a heat-map that translates into a prioritised, zoned security specification.
A homeowner can hold their whole risk picture in their head. A security consultant, facility manager or architect working on a school block, an apartment tower, a hospital wing or a commercial complex cannot — there are too many zones, too many assets and too many people moving through. The professional answer is to map risk: to break the building and its grounds into zones, score each zone methodically, and render the result as a heat-map that everyone from the client to the guard can read at a glance.
This guide gives you that method. It complements the homeowner-facing Security Risk Assessment Guide by going one level deeper and one level wider — a repeatable, defensible technique for larger buildings and multi-zone sites. It is strictly a defender's method: you map risk in order to protect it, prioritising where to spend and what to specify. It never describes how to exploit, defeat or bypass any measure, and it uses only environmental factors and public incident data, never anything that profiles or targets people.
Scope & safety. This is a defensive planning and specification method. Life-safety-critical systems — fire detection and alarms, electronic access control and electric locks, mains electrical, and any structural element (gates, grilles, bollards, safe rooms) — are qualified work: assess and specify here, then have licensed professionals design, install and certify. No security measure may ever obstruct a fire-escape or egress route.
Why map, rather than list
A flat checklist tells you a hundred things are wrong. A risk map tells you which five to fix first, and why. Mapping forces three disciplines that a list does not:
- Spatial thinking. Risk is not evenly spread. It concentrates — at the rear service yard, at an unwatched fire stair, in a basement car park. Mapping makes the concentration visible.
- Comparability. When every zone is scored on the same scale, a facility manager can defend the budget: "the rear yard scores severe, the lobby scores low, so the money goes to the yard."
- Traceability. Each control on the final bill of quantities can be traced back to a specific mapped risk. Nothing is bought because it looked good in a brochure.
The model: assets, threats, vulnerabilities — applied to zones
The engine is the same asset-threat-vulnerability triangle used across security work, but here you apply it per zone rather than to the property as a whole. Risk exists only where a valued asset, a credible threat and an open vulnerability meet in the same place.
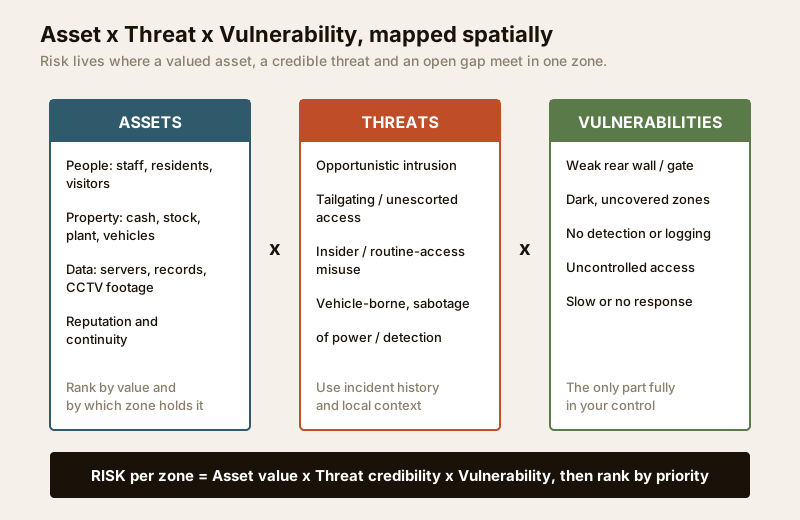
Assets — what each zone holds, and to whom it matters. In a building, assets separate cleanly into three families, and they demand different controls:
- People. Occupants, staff, visitors, children in a school, patients in a hospital. Always the top-ranked asset; a risk to people outranks any property loss.
- Property. Cash, stock, plant and machinery, vehicles, high-value equipment, the fabric of the building itself.
- Data. Servers, records rooms, the CCTV recorder itself, personal data. A data breach can cost more than any physical theft, yet its zone (a small server cupboard) is easy to overlook.
Distinguishing these three matters because the same intrusion has different consequences depending on the asset behind the wall. A breached store loses replaceable stock; a breached records room loses something you cannot buy back. Rank assets by value and note which zone physically holds each one — that mapping is half the work.
Threats — what could credibly act on each zone. Keep this grounded in evidence, not fear. Draw threats from the site's own incident history (the RWA logbook, the facility's guard register, insurance claims), from local context (police-published area trends, neighbouring businesses' experiences), and from the building type. Typical building threats:
- Opportunistic intrusion through a weak or unwatched boundary.
- Tailgating and unescorted access — an outsider following a resident, delivery rider or contractor past a controlled point.
- Insider or routine-access misuse — the everyday reality of staff, housekeeping, drivers and vendors with legitimate access. This is about accountability and controlled access, never suspicion of any individual.
- Sabotage of enabling services — cutting power or tampering with the panel to disable cameras and lighting.
Vulnerabilities — the fixable gaps in each zone. These are the only part fully in your control, and the part your specification will close: weak perimeter, dark or uncovered ground, no detection, no access logging, slow or absent response. A structured walk to find them is covered in the Site Security Assessment guide and, for boundaries specifically, the Perimeter Vulnerability Assessment guide.
Step 1 — Divide the site into zones
Draw or obtain a plan and carve the whole site — grounds included — into named zones. A useful default set for an Indian building or complex:
1. Outer approach and gate — street frontage, main gate, guard post.
2. Parking and circulation — surface or basement parking, driveways.
3. Lobby / reception / entrance — the first controlled interior point.
4. Occupied floors / units — offices, flats, classrooms, wards.
5. Core assets — strongroom, cash office, server / records room.
6. Service and rear — service yard, kitchen, loading, waste, rear boundary.
7. Utility and plant — power, panels, water, lift machine room.
8. Roof, stairs and voids — terrace access, fire stairs, ducts, blind corners.
Each zone gets one row in your register. For the boundary between zones and for the gaps cameras cannot see, cross-reference the Blind-Spot Identification guide and the Entry-Exit Security Assessment guide.
Step 2 — Build the zone-based risk register
For every zone, name the assets it holds, the credible threats, and score likelihood (how plausibly the threat reaches the asset through current gaps) and impact (how bad the loss would be, weighted by asset). Their product gives a priority band. This register is the analytical heart of the map.
| Zone | Key assets | Primary threat | Likelihood | Impact | Priority |
|---|---|---|---|---|---|
| Outer approach / gate | People, first filter | Tailgating, unescorted entry | Likely | Moderate | 2 — Plan soon |
| Parking / basement | Vehicles, people | Theft, loitering, poor sightlines | Possible | Moderate | 3 — Monitor |
| Lobby / reception | People, footfall | Loitering, unlogged visitors | Likely | Minor | 3 — Monitor |
| Occupied floors | People, devices | Opportunistic intrusion | Possible | Major | 2 — Plan soon |
| Core: strongroom / server | Cash, data, records | Targeted theft, data breach | Likely | Severe | 1 — Do now |
| Rear service yard | Fabric, stock | Boundary breach, dark cover | Almost certain | Major | 1 — Do now |
| Utility / plant | Enabling services | Sabotage of power / CCTV | Possible | Major | 2 — Plan soon |
| Roof / fire stairs / voids | Access route | Climb-in, concealment | Possible | Moderate | 3 — Monitor |
Score honestly from evidence. A zone with a long incident history and an open gap is "almost certain," not "possible," however uncomfortable that is to write.
Step 3 — Combine likelihood and impact into risk zones
Plot each zone-threat pair on a likelihood-by-impact matrix. The cell colour is the priority: the redder the cell, the sooner it earns budget. This turns a column of adjectives into a defensible ranking.
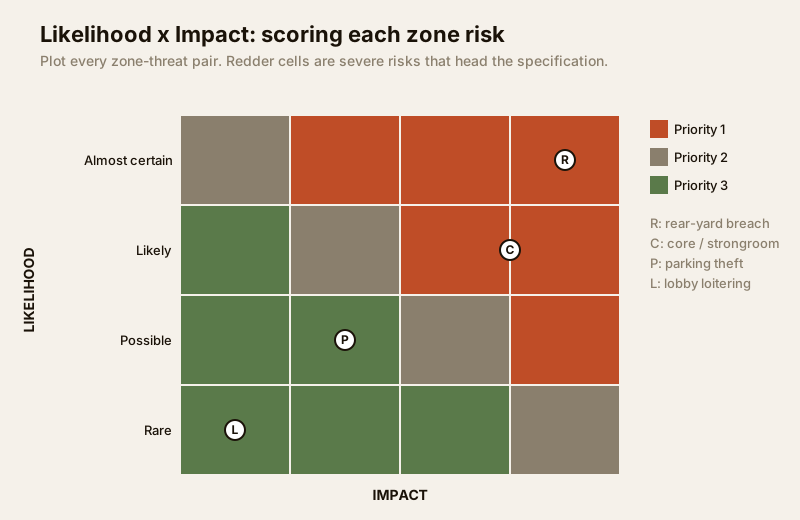
| Priority band | Matrix position | What it means | Response |
|---|---|---|---|
| 1 — Do now | High likelihood, major/severe impact | An easy, damaging path to a valued asset | Specify and close this cycle |
| 2 — Plan soon | Mixed high/medium | A real gap needing budget or a trade | Schedule this quarter |
| 3 — Monitor | Low likelihood or minor impact | Unlikely or low-consequence | Note; revisit at re-assessment |
Two rules keep it practical. First, weight impact by asset: a Severe rating is reserved for zones where people or irreplaceable data are exposed, so those zones float to the top even at moderate likelihood. Second, separate quick wins from projects — a Priority-1 risk that is also cheap and fast to close (a padlock on the rear gate, a sensor light in a dark yard) jumps the queue regardless.
Step 4 — Render the heat-map
Now colour the plan. Shade each zone by its priority band — green for low, muted for medium, terracotta for high. The result is a single image a client understands in three seconds and a guard can act on.
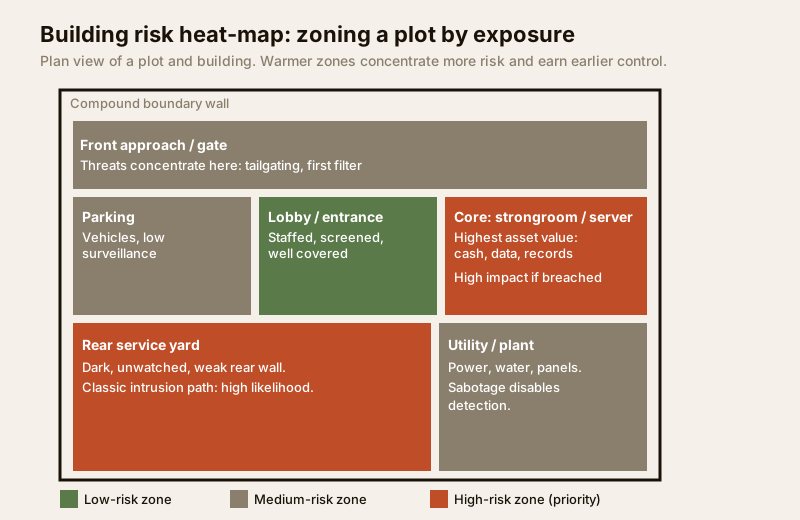
The heat-map is also a communication tool. It shows an RWA committee or a facility owner exactly where their money should go, and it settles arguments — the rear yard is red not because someone worried about it, but because it scored severe on evidence. Keep the map version-dated; it becomes the "before" you measure improvements against.
Step 5 — Translate the map into a zoned specification
A map that does not change what gets built is decoration. The final step maps each high-priority risk to a proportionate control, zone by zone — the reasoning that underpins a layered security design. Specify controls to the risk, not the catalogue.
| Mapped risk (zone) | Control response | Route to |
|---|---|---|
| Tailgating at gate | Access control, visitor logging, guard SOP, turnstile where footfall warrants | Entry-Exit assessment |
| Dark rear-yard breach | Perimeter hardening, sensor lighting, boundary detection, camera on the approach | Perimeter assessment |
| Uncovered blind corners | Reposition or add cameras, prune sightline obstructions, mirrors | Blind-spot mapping |
| Core strongroom / server | Layered access, hardened door, intrusion detection, logged entry, off-site backup for data | Building security systems |
| Basement parking theft | Lighting, camera coverage, controlled vehicle entry | CCTV coverage calculator |
| Sabotage of power / CCTV | Protected panel room, UPS/battery backup for detection, tamper alerts | Electrical guide |
For camera counts and coverage on the heat-map's red zones, the CCTV Camera Coverage Calculator sizes the layout; for the whole-programme budget, sequence spend down the priority list with the Security System Cost Estimator and the Security Cost Planning guide. Because you specified against a ranked map, every rupee is defensible.
Distinguishing people, property and data risk
One discipline separates a professional map from a homeowner's checklist: do not collapse the three asset families into one score. A zone can be low-risk for property yet high-risk for people (a poorly overlooked children's play area) or high-risk for data yet trivial for property (a server cupboard behind a flimsy door). Score each family where relevant, and let people-risk always dominate ties. A useful convention: mark a zone's dominant asset family in the register so the control response is aimed correctly — physical hardening for property, surveillance and access for people-flow, and layered access plus backup for data.
When to bring in a professional
The mapping method is yours to run — you or your team know the site. But hand specific work to qualified specialists: fire detection and alarm design, electronic access control and electric locking, mains electrical and panel work, and any structural element (gates, bollards, grilles, safe-room construction) must be designed, installed and certified by licensed professionals. For a large campus, a multi-tenant tower or a high-value facility, commission an independent physical-security survey to validate your map before major spend. Architects folding security into a new building should start from the Security Design Guide for Architects and coordinate with building regulations and compliance so no control obstructs egress.
Re-map on a cycle
A risk map is a dated snapshot, not a certificate. Re-run it at least annually, and always after an incident on or near the site, a change of use or tenant, a renovation, or the failure of an existing control (a recorder that quietly stopped, a gate propped open by habit). Comparing this year's heat-map with last year's is the clearest proof that the spend actually moved risk down. The master risk assessment and the Home Security Risk Scorecard give a lighter re-scoring loop for smaller properties between full maps.
Key takeaways
- Map, do not just list. Break the building and grounds into named zones and score each on the same scale so risk becomes visible, comparable and traceable.
- Apply asset x threat x vulnerability per zone, ranking assets people-first and noting which zone physically holds each asset — especially data.
- Combine likelihood and impact into a matrix, weight impact by asset, and split quick wins from projects.
- Render a heat-map everyone can read, then translate each high-priority zone into a proportionate, defensible control on the specification.
- Route life-safety and structural work to licensed professionals, never obstruct egress, and re-map at least yearly or after any change.
Begin with the Security Risk Assessment Guide for the underlying model, score smaller sites with the Home Security Risk Scorecard, then browse the full security guides collection to specify each zone in depth.
This is an educational planning and specification method. It is strictly defensive, uses only environmental and public-incident data, and never describes how to defeat any security measure or profile any person. Fire, alarm, electrical, electronic-lock and structural work is qualified professional work — engage licensed installers and verify any applicable National Building Code or municipal bye-law requirement for your project.
Export this guide
Related Guides — Deep-dive reading
Parking Security Audit in India: A Walk-the-Park Method
Most parking areas were never audited honestly. This is the capstone method that ties the whole parking-security library together: walk the park by day and after dark, grade every layer Good / Weak / Absent, gate it on life-safety, and turn the gaps into a prioritised action plan before a thief or an incident finds them first.
SecurityParking Security Lighting in India (2026): Lighting Basement, Stilt and Open Parking So Nothing Hides in the Dark
How to light apartment and commercial parking so vehicles, people and number plates are clearly seen, cameras can actually read the scene, and the space stops being a soft spot for theft and lurking, without ever compromising the emergency lighting on the escape route.
SecurityLift Lobby Security in India (2026): The Control Point Where Public Becomes Private
The lobby is where an outsider is screened, a visitor is verified before the inner door, and access to the lifts and stairs is granted or denied. This guide shows how to design the entrance lobby and the upper lift lobbies so the guard sees who enters, a waiting resident feels safe, and egress always wins.
SecurityRelated Tools — Try Free
Home Security Risk Scorecard
Score your home across six security layers — perimeter, entry points, lighting, detection, alarm and habits — and get a prioritised action plan.
Security ScorecardCCTV Camera Coverage & Count Calculator
Estimate how many CCTV cameras you need, the NVR channels, storage in TB for your retention period, and an indicative all-in cost with GST.
CCTV CalculatorAccess-Control Battery-Backup Calculator
Size the standby battery so an access system keeps running through a power cut, with an egress life-safety note.
Battery Backup