
Sludge Generation Estimation in STPs: How Much Sludge Will Your Plant Produce?
Every STP that cleans water also makes sludge — and the biosolids you forget to plan for become the operating headache you cannot ignore. Here is how to estimate sludge generation, understand the yield concept, and size dewatering before you build.
An STP is often described as a machine that turns dirty water clean. That is only half the story. The pollution the water loses does not vanish — it is transferred into a thick, wet, biologically active solid called sludge. Every kilogram of organic matter and suspended solids the plant removes from the water ends up, in some form, as sludge that has to be thickened, dewatered, stored and carted away. Designers who lavish attention on aeration and forget the sludge line end up with a plant that works beautifully for six months and then chokes on its own biosolids.
This guide is about the number every sludge-handling decision starts from: how much sludge will the plant actually produce? We will cover the yield concept, the rule-of-thumb figures used in Indian practice, the factors that push the number up or down, and how to translate a daily sludge mass into drying beds, filter presses and disposal trips.
A treatment plant does not destroy pollution — it concentrates it. The cleaner the water leaving your STP, the more sludge you are producing and the more seriously you must plan to handle it.
Why sludge estimation matters before you build
Sludge is the single most under-designed part of Indian STPs. The consequences of getting it wrong show up fast:
- Undersized drying beds or presses mean sludge backs up into the biological process, MLSS climbs uncontrollably, and treated-water quality collapses.
- No disposal plan leaves wet sludge piling up on site — a nuisance, an odour source, and a compliance problem when the SPCB inspector arrives.
- Overbuilt handling wastes capital and floor space on a plant that never needed it.
Getting the estimate right early lets you size the sludge line, budget for periodic disposal, and reserve the footprint — all decisions that are painful to retrofit. If you are still at the concept stage, pair this with how to size an STP and the STP Capacity Calculator so flow, load and sludge are all sized off the same design basis.
The yield concept: kg of sludge per kg of BOD removed
The heart of sludge generation estimation is a simple idea. When microbes eat the organic waste (measured as BOD) in an aeration tank, they use part of it for energy and convert the rest into new microbial cells — their own bodies. Those extra cells are biological (secondary) sludge. So the more BOD you remove, the more biomass you grow.
Engineers capture this with a yield coefficient, usually written as Y, expressed as kg of sludge produced per kg of BOD removed. For a conventional activated sludge process treating domestic sewage, Y typically lands in the range of 0.6 to 0.8 kg VSS per kg BOD removed at the point of synthesis, settling to a lower net figure once endogenous decay (microbes eating themselves during aeration) is accounted for. In everyday design shorthand, many Indian consultants use a lumped figure of roughly 0.6 to 1.0 kg of dry sludge solids per kg of BOD removed for the biological fraction.
There are two distinct sludge streams to add up:
- Primary sludge — the solids that settle out in a primary clarifier or the primary zone, before biological treatment. Present only if the plant has a primary settling stage (many compact MBBR/SBR plants skip it).
- Secondary (biological) sludge — the surplus microbial biomass wasted from the aeration/clarifier system, also called Waste Activated Sludge (WAS).
The total dry sludge mass is the sum of both. To find the BOD actually removed, you need the incoming load, which comes from flow and concentration — the organic loading calculator does exactly this conversion.
A worked estimate
Take a residential complex with a 500 KLD STP. Assume raw sewage at BOD 300 mg/L, and the plant removes 95% of it to reach a treated BOD below 10.
| Step | Calculation | Result |
|---|---|---|
| Daily flow | Given | 500 m³/day |
| BOD load in | 500 × 300 ÷ 1000 | 150 kg BOD/day |
| BOD removed (95%) | 150 × 0.95 | ~143 kg BOD/day |
| Biological sludge (Y ≈ 0.8) | 143 × 0.8 | ~114 kg dry solids/day |
| Add primary/inert fraction | rough +15–25% | ~130–140 kg dry solids/day |
So this plant makes on the order of 130–140 kg of dry sludge per day. That sounds manageable — until you remember the sludge leaves the tanks as a watery slurry, not dry powder.
Waste activated sludge is typically 99% water (about 0.8–1.2% solids). At 1% solids, 130 kg of dry solids is carried in roughly 13,000 litres — 13 m³ — of wet sludge every day. This is the number that determines how big your thickening and dewatering equipment must be, and it is why dewatering is the whole game: your job is to squeeze that 13 m³ of slurry down to a stackable cake.
What drives the number up or down

Sludge generation is not a fixed constant. Several factors shift it:
- Incoming BOD and TSS strength. Higher-strength sewage means more load removed and more sludge. Kitchen-heavy, low-dilution flows produce noticeably more than dilute sewage. Understand your influent first via wastewater characteristics — BOD, COD, TSS, pH.
- Treatment technology. Extended-aeration processes and SBR run at long sludge age, so more biomass self-digests and net sludge is lower — but the sludge is well-stabilised. MBBR and MBR systems each have their own yield behaviour and solids concentration.
- Sludge age (SRT). The longer solids stay in the system, the more endogenous decay reduces net yield — but the slower they settle. It is a trade-off, not a free lunch.
- Chemical dosing. Any alum, ferric or polymer added for phosphorus removal or clarification adds chemical sludge on top of the biological figure — sometimes a large addition.
- Inert and grit fraction. Fixed non-biodegradable solids in the influent pass straight through into the sludge.
A quick sanity benchmark used in the field: domestic STPs commonly generate roughly 0.2 to 0.3 kg of dry sludge per kg of BOD applied, or about 150–250 grams of dry solids per person per day — useful for cross-checking a detailed estimate.
Turning sludge mass into a handling plan
Once you have a defensible daily dry-solids figure, the design follows:
1. Thickening. Gravity thickeners or thickening in the clarifier hopper raise solids from ~1% toward 2–4%, cutting the volume before dewatering.
2. Dewatering. This is where the volume really drops. Common options in Indian STPs:
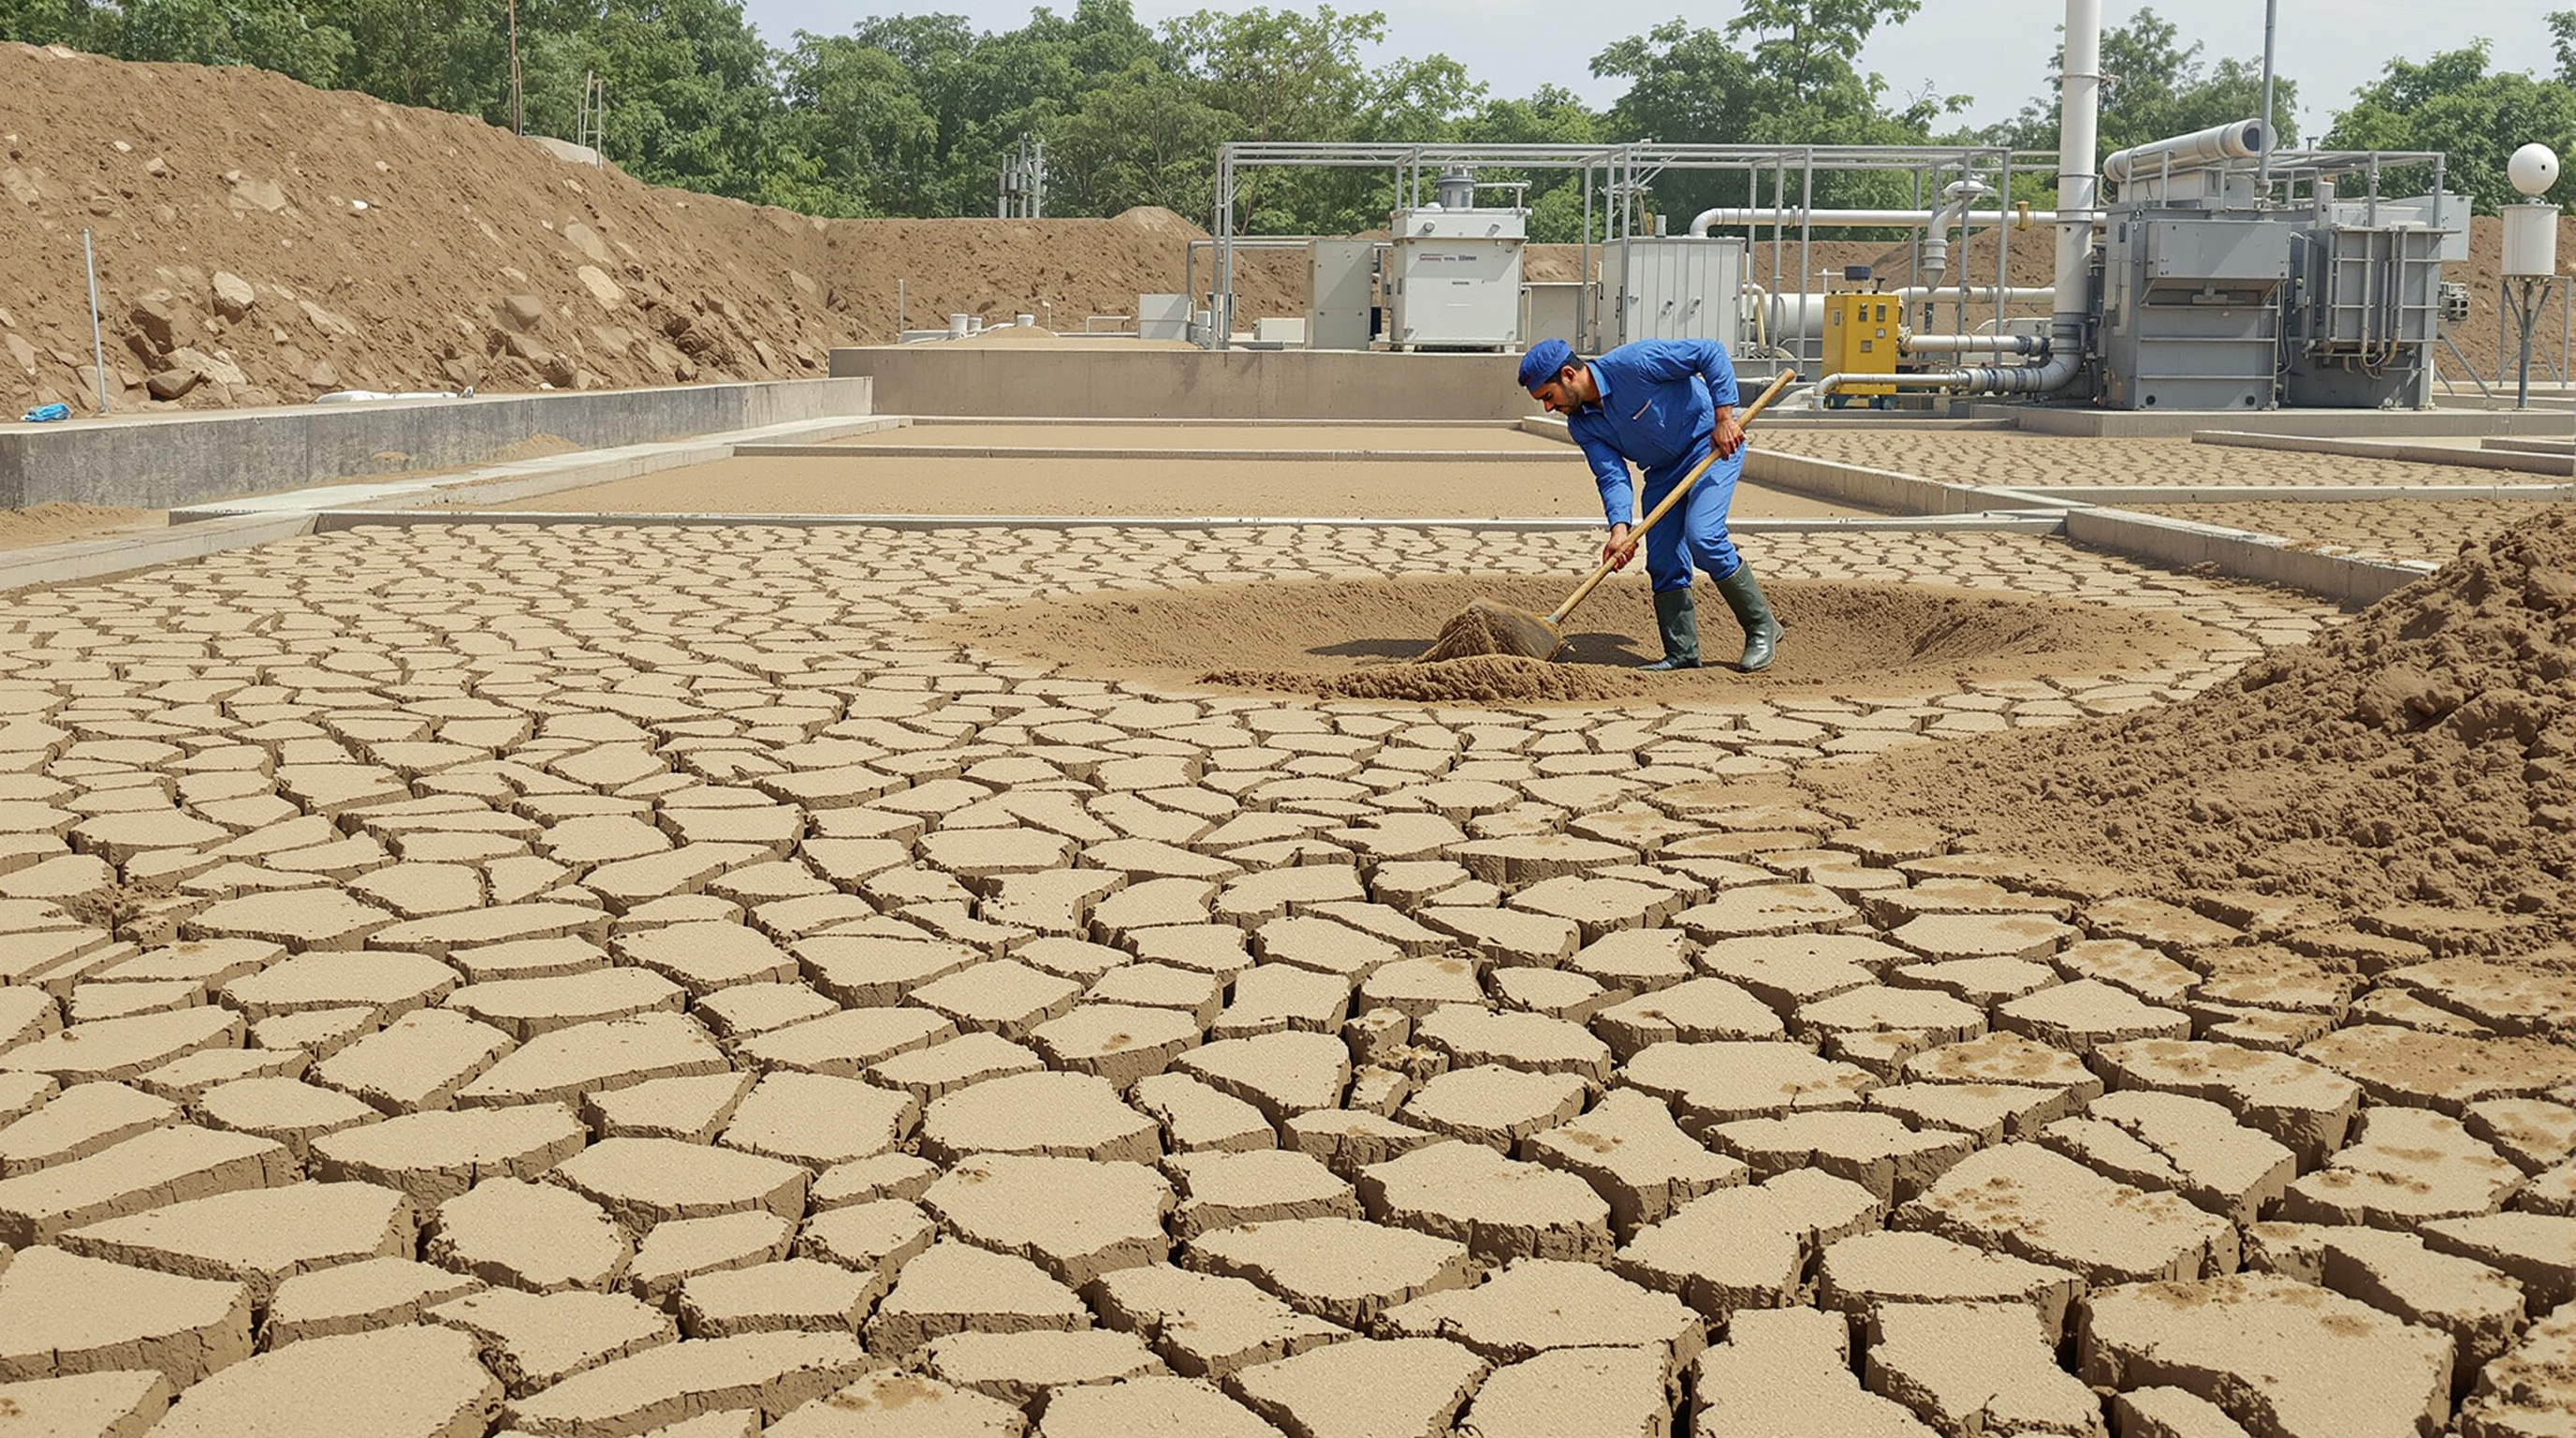
- Sludge drying beds — cheap, land-hungry, weather-dependent; sun and drainage take the cake to 20–30% solids over days. Suited to smaller plants with spare land.
- Filter press / belt press / centrifuge / screw press — mechanical, compact, produce a cake at 18–25% solids reliably regardless of weather. Standard for medium and large plants where land is scarce.
3. Disposal. The dewatered cake — now a fraction of the original volume — is carted for co-composting, landfill, or authorised biosolids disposal per SPCB direction. Budget the tanker trips: they are a recurring operating cost, not a one-time item.
Sizing the press or beds means matching them to the daily wet-sludge volume, the intended cake dryness, and how many hours a day you plan to run the equipment. The Sludge Generation Calculator does this end-to-end — enter flow, influent BOD and removal efficiency and it returns dry-solids mass, wet-sludge volume, and an indicative dewatering duty, so you can size the sludge line off the same basis as the rest of the plant.
The bottom line
Sludge generation estimation comes down to one chain of logic: flow × concentration gives the load; the load removed, multiplied by a yield of roughly 0.6–1.0 kg per kg of BOD removed, gives the dry sludge mass; and the slurry's low solids content turns that modest mass into a large daily volume of wet sludge to dewater. Estimate it early, add the chemical and inert fractions, and size drying beds or a press to match — because the plant that ignores its sludge line is the plant that fails at it.
From here, tighten the numbers feeding the estimate with understanding organic loading and understanding hydraulic retention time, or return to the Sewage Treatment Plants guide library for the full design picture. And to put a real figure on your own plant, spend a minute with the Sludge Generation Calculator.
Export this guide
Related Guides — Deep-dive reading
Understanding Hydraulic Retention Time (HRT) in STPs: The Complete Guide
What hydraulic retention time really means, how it sets the size of your reactor and the quality of your treated water, typical HRT figures for ASP, MBBR, SBR and UASB, and why HRT and SRT are two different clocks you must not confuse.
Sewage Treatment PlantsSludge Dewatering Methods for STPs: Filter Press, Centrifuge, Screw Press & Geobags Compared
Every STP produces sludge, and getting the water out of it is the messiest, most underestimated part of running one. Here is how filter presses, centrifuges, screw presses and geobags actually dewater sludge — with honest pros, cons and a way to choose by scale.
Sewage Treatment PlantsAeration Tank: The Biological Heart of an STP
The tank where blowers push oxygen into billions of microbes that eat the sewage's organic load — how it works, what DO, MLSS, F/M and HRT mean, and why it quietly runs up the biggest electricity bill in the plant.
Sewage Treatment PlantsRelated Tools — Try Free
Population Equivalent (PE) Calculator
Convert an organic pollution load into Population Equivalent from flow and BOD concentration — the BOD load in kg/day and equivalent number of people.
STP CalculatorSludge Generation Calculator
Estimate the dry and wet sludge your STP produces from flow, BOD removal and sludge yield.
STP CalculatorHydraulic Retention Time (HRT) Calculator
Compute a reactor or tank's hydraulic retention time from its volume and daily flow, and benchmark it against recommended ASP, MBBR and SBR ranges.
STP Calculator