
Sewage Generation Calculation Explained: From Water Supply to KLD and Peak Flow
How engineers turn a building's water demand into a sewage figure — the ~80% return factor, diurnal variation, infiltration and the peak-flow multiplier — so you get an STP that is sized right, not guessed.
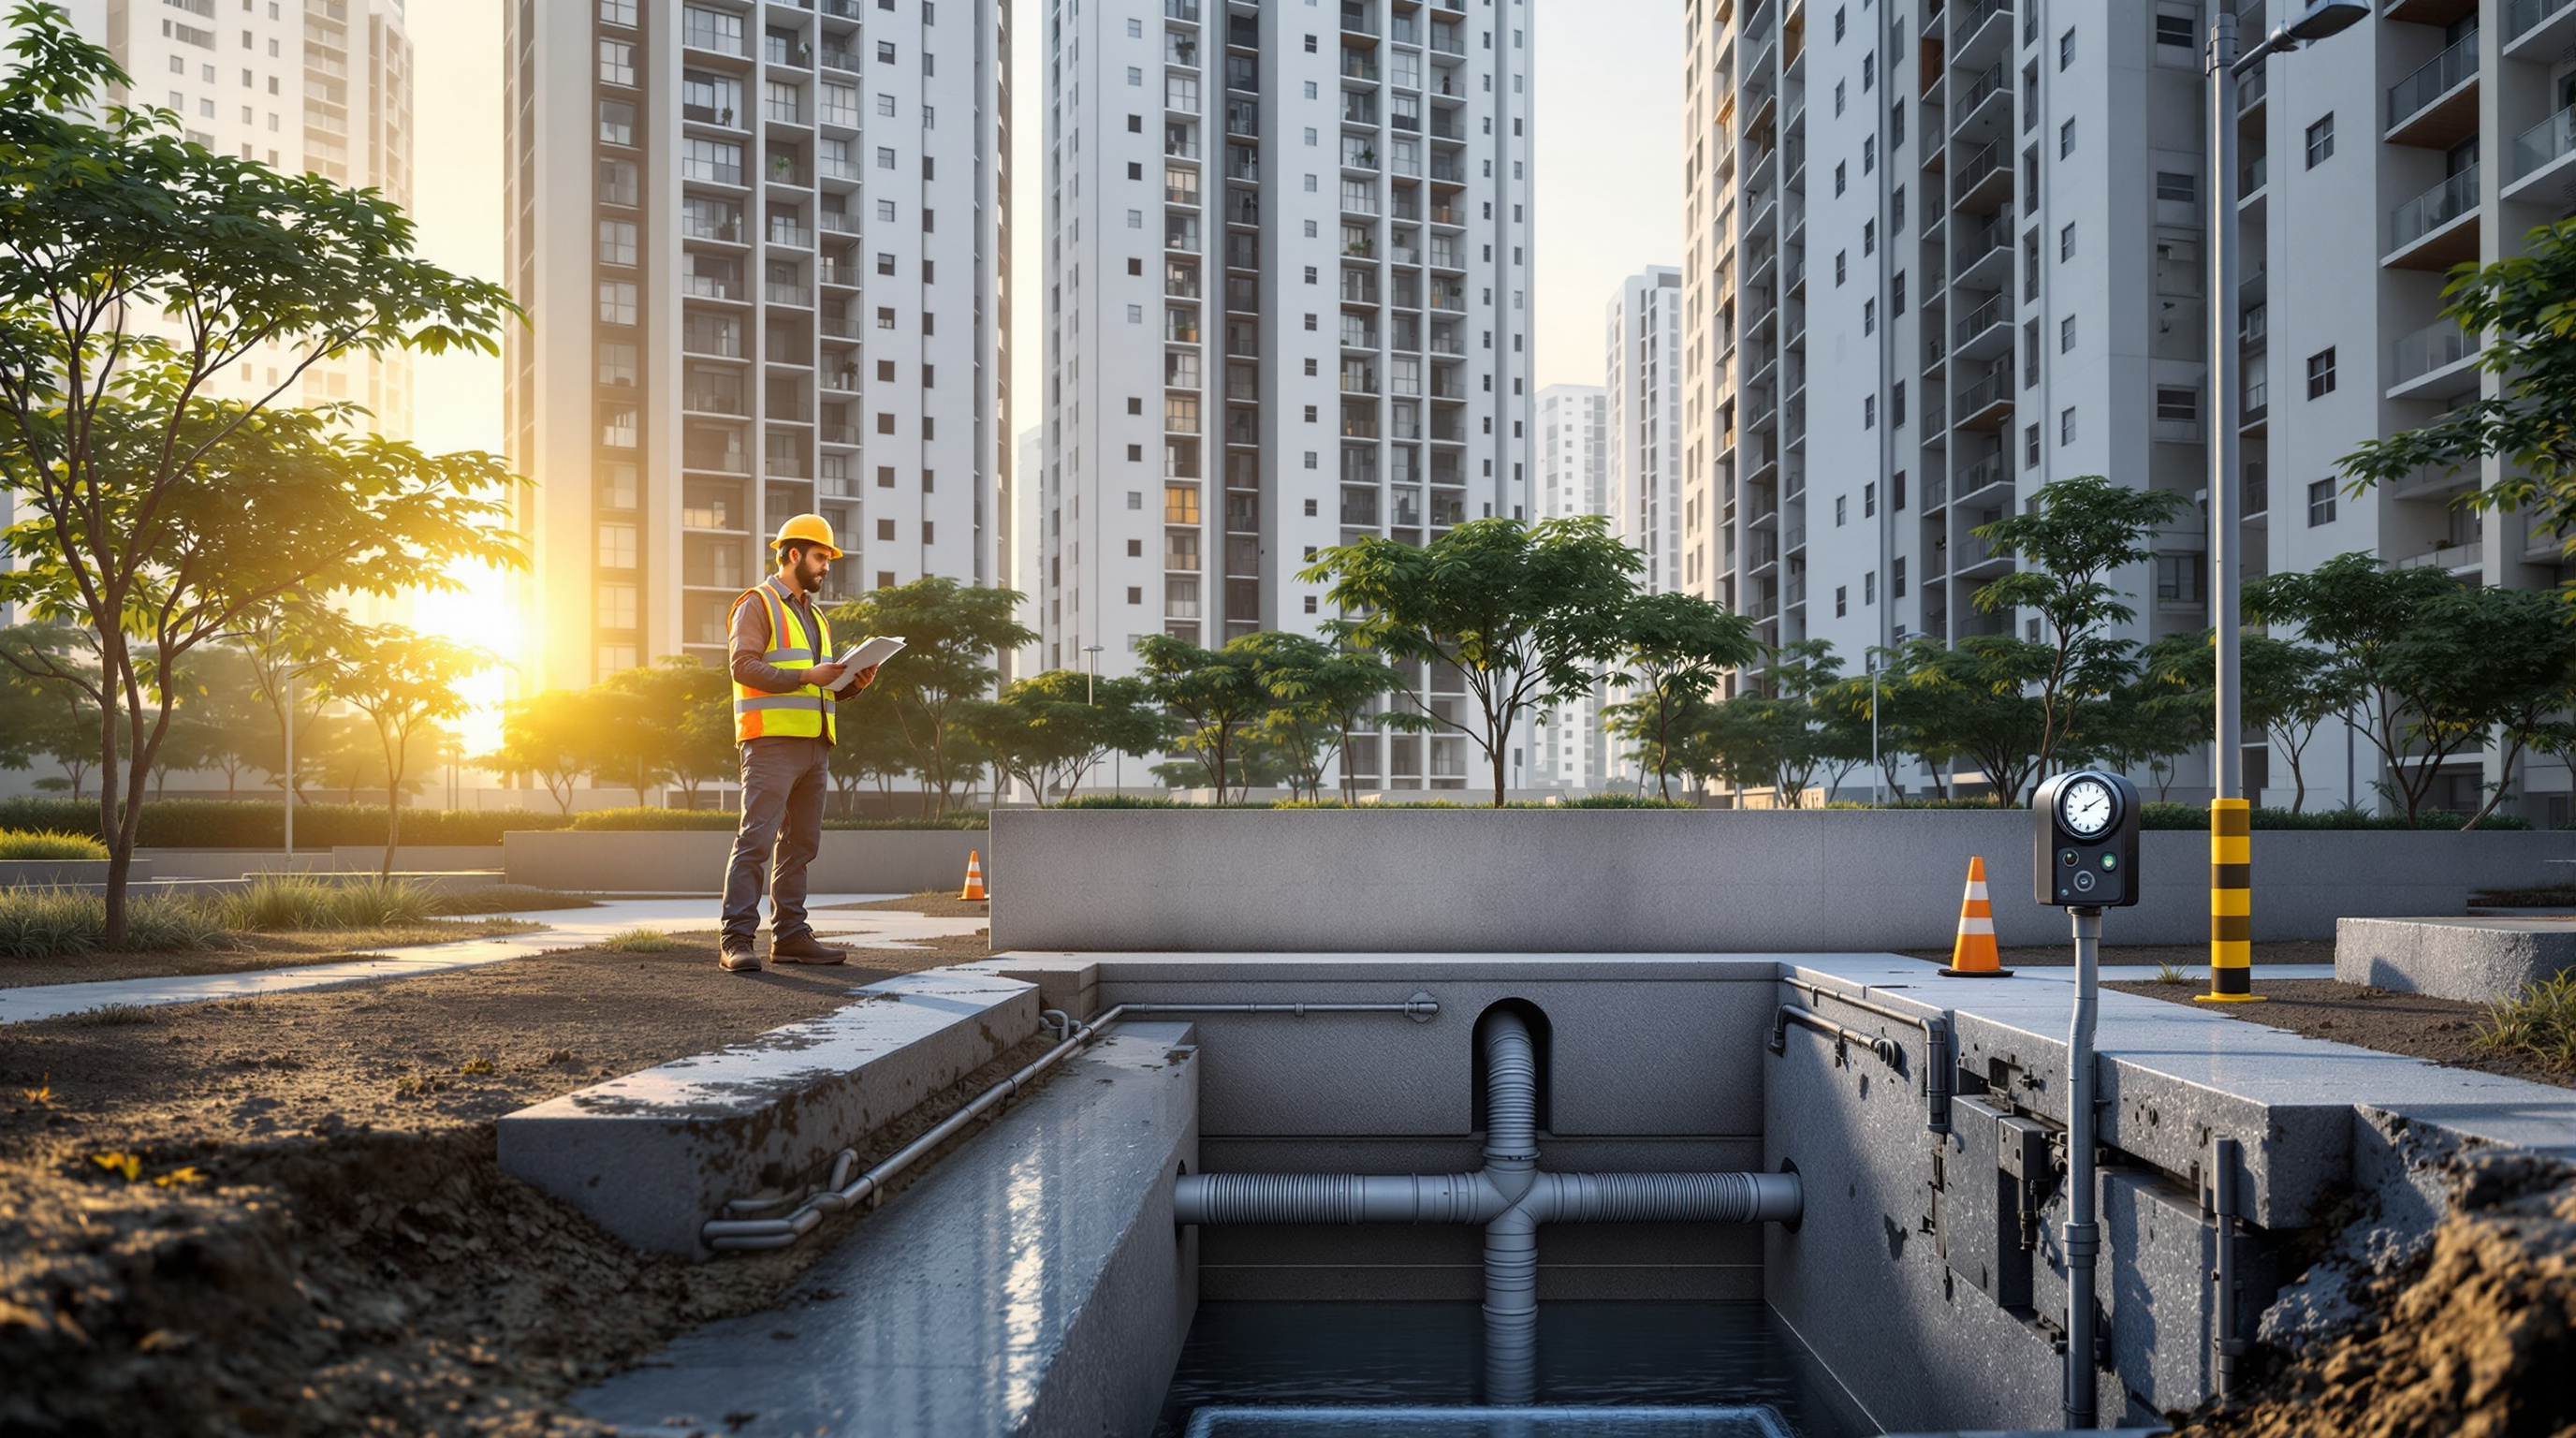
Before anyone can size an aeration tank, order blowers or price an STP, one number has to be settled: how much sewage will this building actually produce every day? Get it wrong on the high side and you buy a plant that is oversized, expensive and never runs efficiently. Get it wrong on the low side and the STP chokes on day one, overflows at peak hours, and fails its consent conditions. Everything downstream — tank volumes, pump heads, air demand, sludge output — is built on this single figure.
The good news is that sewage generation calculation is not guesswork. It follows a short, defensible chain of logic that starts from something you already know — how much water the building consumes — and applies a few well-established factors to arrive at a design flow in KLD (kilolitres per day) and a peak flow in cubic metres per hour.
Sewage is not created; it is water that has already been supplied and used. So the honest way to estimate it is to start from water demand and ask: what fraction of that water comes back out as sewage, and how unevenly does it arrive?
Start from water, not from sewage
The foundation of every sewage estimate is the building's water demand. You cannot generate more sewage than the water you bring in, so water supply is the ceiling and the starting point. In Indian practice this is usually built up per person, per day — the per-capita water supply — multiplied by the design population.
Typical planning figures (broadly aligned with CPHEEO and local building-bye-law guidance) run roughly like this:
| Occupancy type | Water demand (per person/day) | Notes |
|---|---|---|
| Residential apartments | 135–150 litres | The most common baseline |
| IT / office (per seat) | 45–60 litres | Lower — no cooking, no bathing |
| Hotels (per bed) | 180–220 litres | Laundry and kitchen push it up |
| Hospitals (per bed) | 400–450 litres | Highest per-capita of common uses |
| Schools (day scholars) | 45 litres | Only part-day occupancy |
Nail the population and the per-capita demand first, and the rest of the sewage generation calculation is arithmetic. If you want to see how the occupancy and demand assumptions are built up, the water consumption estimation guide walks through it in detail.
The return factor: the 80% rule
Not all the water a building consumes becomes sewage. Some is lost to evaporation, to garden irrigation, to cooling-tower drift, to swimming pools, to the water that simply leaves as steam or soaks into landscaping. The share of supplied water that actually returns to the drains as wastewater is the return factor (sometimes called the sewage return coefficient).
For ordinary domestic and commercial buildings, the accepted planning value is about 80% — often written as a range of 0.80 to 0.85. So:
- Average sewage generation = Water demand × Return factor (≈ 0.80)
A residential tower housing 1,000 people at 135 litres/person/day supplies 135 KLD of water. At an 80% return factor, its average sewage generation is:
- 135 KLD × 0.80 = 108 KLD
That 108 KLD is the average daily flow (ADF) — the single most important number in the whole exercise, and the figure the sewage generation calculator produces for you once you enter occupancy and building type.
A few cautions on the return factor:
- Large landscaping or cooling loads pull the effective return factor down — more of the water never reaches the drains.
- Fully air-conditioned offices with little irrigation can sit closer to 0.85.
- Industrial processes are a different animal entirely. Their effluent return depends on the process, not on domestic habits, and that effluent usually needs an ETP, not a domestic STP. If your project is industrial, read STPs vs ETPs before applying any domestic return factor.
Infiltration: the water you did not supply
There is a second contribution that is easy to forget. In gravity sewer networks, groundwater seeps in through joints, cracks and manholes, and stormwater sometimes leaks into the system. This infiltration and inflow adds to the flow the STP actually receives, even though nobody consumed it.
For a compact, self-contained building on a modern internal drainage network, infiltration is small and often ignored. But for larger campuses, township-scale collection systems, or older pipework, designers add an allowance — commonly a modest percentage of the average flow, or a per-length/per-hectare figure. The safe practice is to add infiltration on top of the return-factor flow, not to bury it inside the return factor.
Average flow is not design flow: diurnal variation
Here is the trap that catches inexperienced designers. The 108 KLD figure above is a daily average — it assumes sewage trickles in evenly across 24 hours. It never does.
Real buildings breathe. Sewage flow spikes in the morning (showers, toilets, breakfast) and again in the evening, and falls to almost nothing at 3 a.m. This uneven, hour-by-hour swing is diurnal variation, and it means the plant must cope with flows well above the daily average for part of every day.
We capture this with a peak factor:
- Peak flow = Average flow × Peak factor
The peak factor depends on the population served — smaller populations swing more violently because there is less averaging-out. Common planning values:
| Design population | Typical peak factor |
|---|---|
| Up to ~1,000 | 3.0 |
| ~1,000 – 20,000 | 2.5 |
| Above ~50,000 | 2.0 |
For our 1,000-person tower at an ADF of 108 KLD, a peak factor of around 3.0 gives a peak flow of:
- 108 KLD × 3.0 = 324 KLD, or about 13.5 m³/hour at the peak
Two numbers now matter, and they do different jobs:
- Average flow (108 KLD) sizes the biological heart of the plant — the aeration tank volume, the oxygen demand, the sludge production — because microbes respond to the daily load, not the momentary rush.
- Peak flow (≈13.5 m³/h) sizes the hydraulic parts — pumps, pipe diameters, screens, the clarifier surface area — because these must physically pass the busiest hour without backing up.
The equalization tank is the classic device that reconciles the two: it stores the morning surge and releases it slowly, so the downstream plant sees something much closer to the steady average. Sizing that buffer well is precisely why peak-flow design deserves its own attention.
Putting the whole calculation together
Assembled end to end, a clean sewage generation calculation reads like this:
1. Population — from unit count, occupancy or seats.
2. Water demand — population × per-capita demand → KLD supplied.
3. Average sewage — water demand × return factor (≈0.80) → ADF in KLD.
4. Add infiltration — a small allowance where the network warrants it.
5. Peak flow — ADF × peak factor → the hydraulic design flow.
6. Add a design margin — a sensible buffer for future occupancy and safety.
The result is not one number but a small family of them, each feeding a different part of the design. The ADF becomes the headline STP capacity; the peak flow sets the hydraulics; and the organic load derived from the ADF drives the biology.
From flow to a sized plant
A sewage figure on its own is only the entrance ticket. Once you have the ADF and peak flow, the design cascade continues:
- The flow and its retention time set tank volumes — see hydraulic retention time.
- The flow times the influent BOD gives the organic loading the microbes must digest — the basis of understanding organic loading.
- The load and flow together predict sludge generation, which sizes your dewatering and disposal.
- Finally, the flow rolls up into overall STP capacity and technology selection.
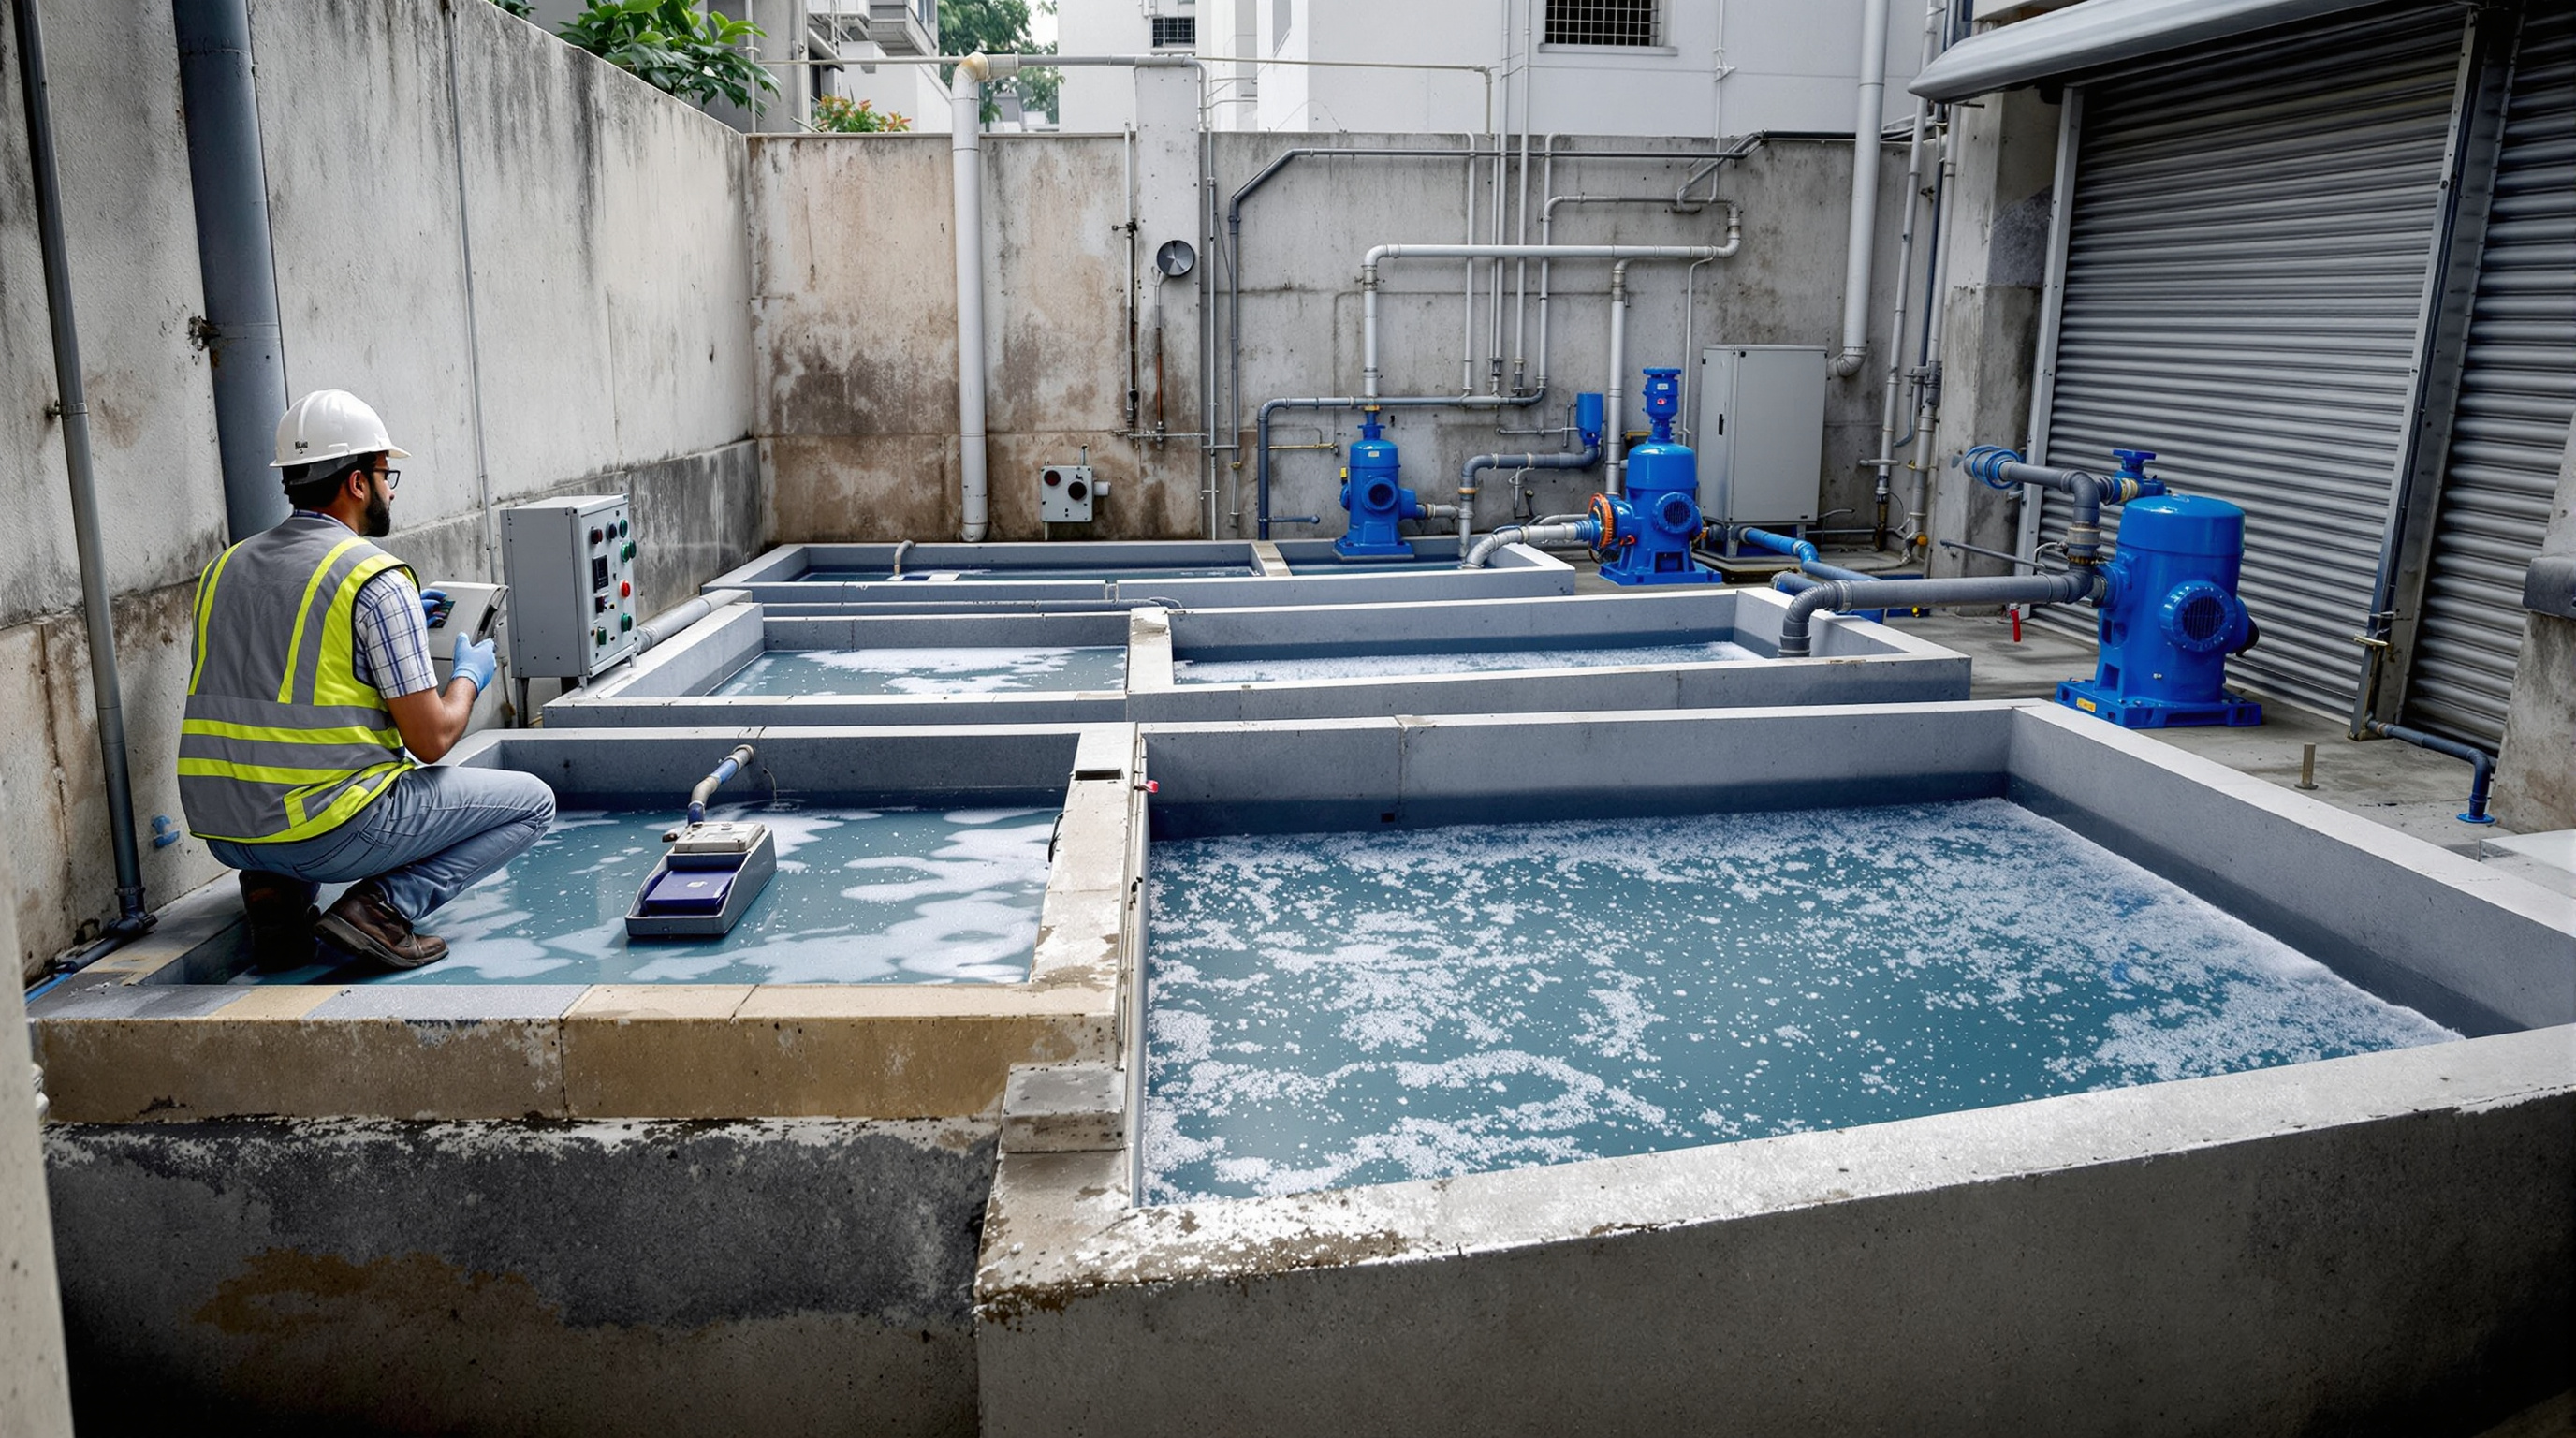
If you are new to why the plant exists at all, start with what is a sewage treatment plant and how does an STP work; if you are ready to size one, how to size an STP picks up exactly where this calculation ends.
The bottom line
Sewage generation is derived, not measured, at the design stage — and it is derived honestly by starting from water supply. Multiply water demand by a return factor near 0.80 to get the average daily flow in KLD, add infiltration where the network calls for it, then apply a population-based peak factor to get the design peak flow. Keep the average and the peak as separate numbers doing separate jobs, and you have the two figures every correctly sized STP is built on. Run your own occupancy through the sewage generation calculator, then continue through the Sewage Treatment Plants guide library to turn that flow into a finished design.
Export this guide
Related Guides — Deep-dive reading
Water Consumption Estimation for Buildings: LPCD Norms, Occupancy & End-Use Breakdown
How to estimate a building's daily water demand from its occupancy and NBC per-capita norms, break it down by end use, and turn that number into the foundation for sizing water supply, storage and sewage systems.
Sewage Treatment PlantsHow to Size an STP: A Step-by-Step Method (With Worked Example)
The complete sizing methodology for a domestic sewage treatment plant — from headcount and LPCD to sewage generation, peak flow and tank-by-tank volumes — worked end to end with an Indian apartment example.
Sewage Treatment PlantsUnderstanding Hydraulic Retention Time (HRT) in STPs: The Complete Guide
What hydraulic retention time really means, how it sets the size of your reactor and the quality of your treated water, typical HRT figures for ASP, MBBR, SBR and UASB, and why HRT and SRT are two different clocks you must not confuse.
Sewage Treatment PlantsRelated Tools — Try Free
Sewage Generation Calculator
Estimate the daily sewage a building generates and its peak flow in KLD from occupancy, LPCD, sewage return factor and peak factor.
STP CalculatorPool Volume Calculator
Water volume in litres, US gallons and cubic metres, by pool shape and depth.
Pool CalculatorApartment STP Planner
Plan an apartment complex sewage treatment plant from flats and occupancy — get population load, sewage flow, recommended STP capacity in KLD, treatment technology and approximate space.
Planner