
Security Cost Per Square Foot in India (2026): The Benchmark and Its Honest Limits
What the per-square-foot security metric really is, why it is a rough benchmark and never a formula, how it falls for larger buildings and varies by building type, and how to use it to sanity-check a budget rather than to size a system.
Ask a developer, an architect or a facility manager what security should cost, and sooner or later someone reaches for a rate: so many rupees per square foot. It is a tempting shorthand. Every building already has a built-up area on the drawings, a budget already gets tracked per square foot for civil and services, and a single number that says "security should be about X per square foot" feels like a quick way to sanity-check whether a quote is sane or a proposal is padded. Used that way, the per-square-foot metric earns its place in a professional's toolkit.
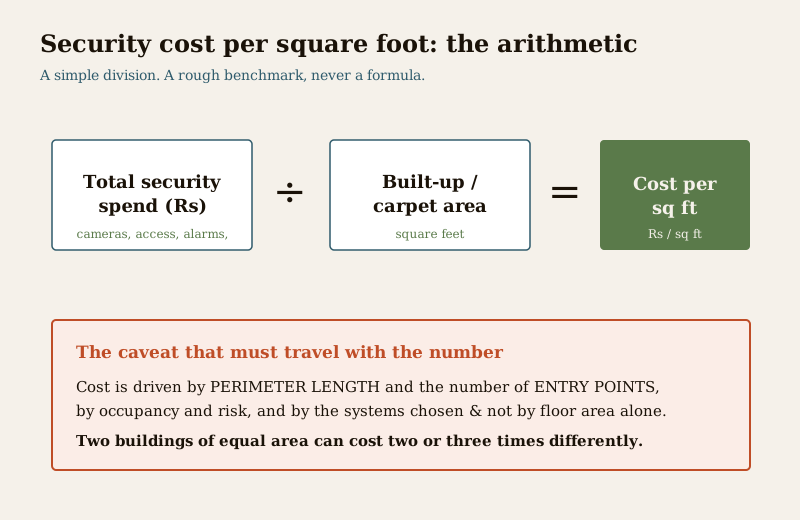
Used the other way — as a formula to size a system — it quietly misleads. Security cost is not driven by floor area. It is driven by how long the boundary is, how many entry points must be controlled, who occupies the building and what they are worth stealing, and which systems the risk actually calls for. Two buildings with identical carpet area can carry security budgets that differ two or three times over, because one is a long, thin plot with five gates on a busy road and the other is a compact block with a single controlled entrance. The area is the same; the security problem is not.
This guide is about using the metric honestly: what it is, why it behaves the way it does, roughly where the bands sit by building type, and — the part most rate-of-thumb conversations skip — its limits. It is the benchmarking chapter of the wider home security system cost guide, and it sits inside the security cost planning guide that ties a whole budget together.
Scope & safety. The per-square-foot bands here are indicative, wide, verify-locally benchmarks for sanity-checking a budget — not quotes, not a price list, and never a way to size a system. Prices move with place, time, spec, brand and site access, and GST applies on top of every figure. Always get at least three written, itemised quotes and design the system bottom-up from the actual threat and layout, then use the per-square-foot number only to check the total for sanity. This guide separates one-time capex per square foot from ongoing opex per square foot, because the running cost is where buyers are most often surprised. CCTV and access logs hold personal data under the DPDP Act 2023; guards must come through a PSARA 2005-registered agency; and life-safety and egress under the National Building Code (NBC = SP 7:2026) are never a per-square-foot line to trim.
What the metric actually is
Security cost per square foot is arithmetic, nothing more: take the total security spend for a building and divide it by the built-up (or carpet) area. If a project's whole security package — cameras, access control, alarms, cabling, a control room, guarding infrastructure, installation — comes to a certain figure, and you divide by the square footage, you get a per-square-foot rate. Do the same with only the annual running cost and you get an opex-per-square-foot figure.
That is genuinely useful for three things, and only three:
- Sanity-checking a total. If a vendor's proposal for a mid-size office lands far outside the rough band that comparable offices sit in, that is a prompt to ask why — either the building has an unusual risk that justifies it, or the quote is padded, or it is dangerously thin.
- Comparing options at the same building. Two proposals for the same site can be normalised to a per-square-foot rate and set side by side, which strips away differences in how each vendor presented the number.
- Early, order-of-magnitude budgeting. Before a design exists, a per-square-foot band lets a developer pencil in a provisional line so security is not forgotten until the walls are up — as long as everyone treats it as a placeholder to be replaced by a real bottom-up design.
What it is not is a specification. It cannot tell you how many cameras to buy or where the access-controlled doors go. The moment the number leaves the sanity-check column and starts to determine the design, it has been misused.
Why it is a benchmark and not a formula
The reason the metric cannot size a system is that floor area is not what security costs track. Cost is driven by a different set of things entirely:
- Perimeter length. Security largely happens at the boundary and the skin of the building. A long boundary costs more to wall, light, detect and patrol than a short one — and boundary length does not move in step with floor area. A single tall tower and a sprawling low campus can enclose the same square footage behind wildly different lengths of line. This is exactly why perimeter is priced by the running metre, not the square foot; see the perimeter security cost guide.
- Number of entry points. Every gate, door and dock that must be controlled is a cluster of cost — a reader, a lock, a camera, cabling, a line in the access system. A building with one controlled entrance and a building of the same area with six each cost very differently, and the area does not reveal how many there are.
- Occupancy and risk. What the building holds and who uses it drives the specification far more than its size. A jewellery showroom, a data-holding office and a records store demand hardening that a bulk warehouse of the same footprint never will.
- The systems the risk calls for. Analogue versus IP CCTV, basic access control versus a full integrated head-end, guarded versus monitored — these choices swing the total, and they follow the threat, not the area.
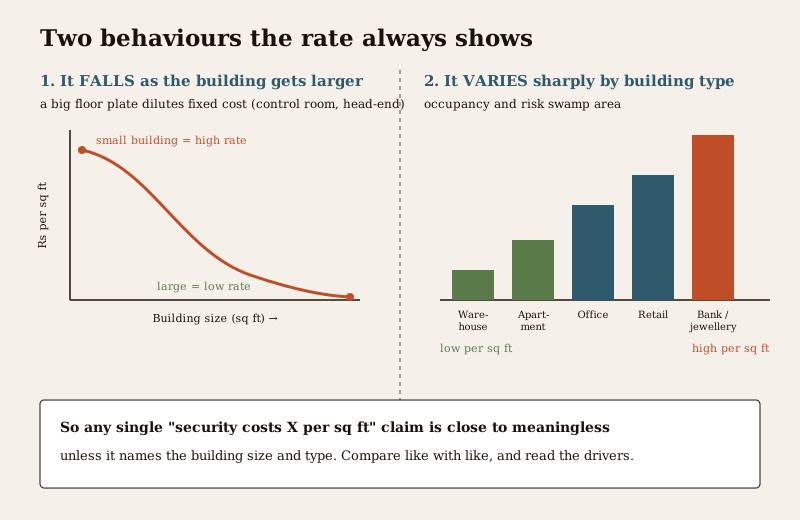
Two behaviours you must expect
Because area is not the true driver, the per-square-foot number does two things that trip up anyone who treats it as a constant rate.
It falls as the building gets larger
A large chunk of a security system is fixed cost that a building pays once regardless of size: a control room, the recording and head-end equipment, the network backbone, the guard post and gatehouse, the monitoring subscription. Spread that fixed cost across a small building and the per-square-foot rate is high; spread the very same head-end across a big floor plate and it is diluted, so the rate falls. A large distribution centre can post a strikingly low security cost per square foot not because it is under-protected, but because its enormous area divides a control room and a perimeter that a much smaller building would have paid a similar amount for. The metric bends with scale, and comparing a small building's rate against a large one's is comparing two different things.
It varies enormously by building type
The second behaviour is that occupancy swamps area. A bulk warehouse spends little per square foot: vast area, modest per-metre perimeter, cameras and access concentrated at the gate and docks, and long stretches of low-value floor. A bank vault area or a jewellery showroom sits at the opposite extreme — dense, high-value, heavily hardened space where the per-square-foot rate is many times higher. Homes, apartments, offices and retail fall in between, each with its own logic. Any single "security costs X per square foot" claim that ignores building type is close to meaningless.
Indicative bands by building type
With every caveat above firmly in place, the following are wide, ballpark, capex benchmarks for the initial one-time security build, expressed per square foot of built-up area. They exist to sanity-check a total, never to size a system, and they must be verified locally and read together with the drivers that move a building up or down its band.
| Building type | Rough capex band (per sq ft) | What moves it up or down |
|---|---|---|
| Independent home / villa | Wide and highly variable | Boundary length, number of gates and doors, IP vs basic CCTV, whether guarded; a compact home is low, a large villa with a long wall much higher |
| Apartment block (per built-up sq ft) | Low to moderate | Number of towers and entries, basement and lobby control, intercom scale; dilutes across many flats — see the security cost per apartment guide |
| Office / commercial | Moderate | Access-control density, number of controlled doors, integrated head-end, reception and turnstiles, IP camera count |
| Retail store / showroom | Moderate to high | Value of stock, entry and exit control, anti-theft, camera density over the sales floor and till |
| Bank / jewellery / high-value | High to very high | Vault and strongroom hardening, dense CCTV, layered access, alarms and guarding — risk-driven, not area-driven |
| Warehouse / logistics | Low | Huge area dilutes fixed cost; spend concentrates at the gate and docks — see the warehouse security guide |
Notice how little the number tells you on its own and how much the driver column does. A large villa and a compact home are both "homes" yet can sit at opposite ends of a very wide band; the reason lives in the right-hand column, not the left. That is the metric behaving exactly as it should — as a prompt to ask the right questions, not an answer.
Separate capex per square foot from opex per square foot
The single most useful discipline with this metric is to run it twice: once for the one-time build and once for the annual running cost. They behave differently and are budgeted from different pots.
- Capex per square foot covers the one-time build — cameras, access hardware, alarms, cabling, control room, installation and commissioning. It is what most people mean when they quote a "per square foot" security rate, and it is a capital line.
- Opex per square foot covers the annual running cost — guarding (usually the largest by far, and priced per guard-shift through a PSARA-registered agency, not per square foot at all), monitoring subscriptions, cloud or on-site storage, AMC and servicing, electricity, and eventual replacement. Over a building's life this recurring figure typically dwarfs the capex, and a low capex-per-square-foot rate bought with cheap hardware often buys a higher lifetime cost. The security lifecycle cost guide works through the total-cost-of-ownership view that a single per-square-foot capex number hides.
A quote that shows a flattering capex per square foot while staying silent on the running cost has told you the cheap half of the story. Always ask both.
The honest way to use it: bottom-up, not top-down
Here is the rule that keeps the metric on the right side of useful. Design bottom-up from the actual risk and the real layout — then use per-square-foot only to sanity-check the total. Never start from a rate and multiply up.
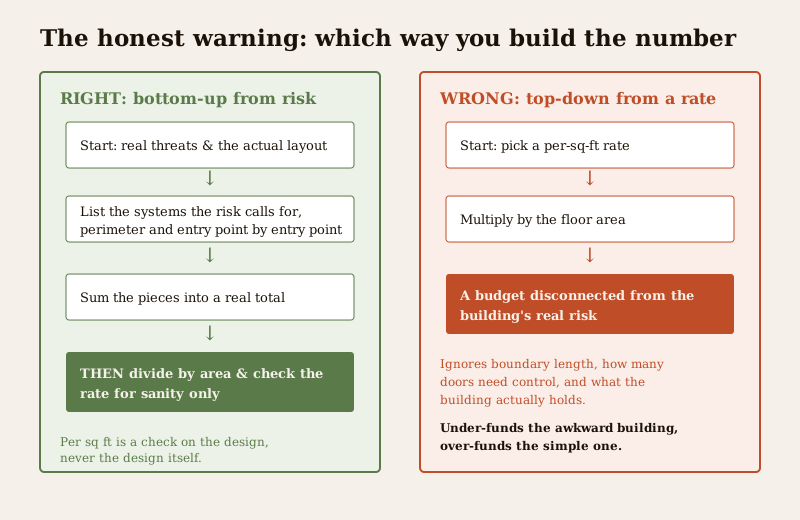
A bottom-up design walks the building the way the whole hub teaches: name the threats, map the perimeter and the entry points, decide what must be controlled and watched and detected, choose systems that fit the risk, and cost each one. The security cost planning guide sets out that method, and component guides such as the CCTV installation cost guide price the pieces. Sum those pieces and you have a real number. Then divide by area and glance at the per-square-foot rate: if it lands far outside the rough band for the building type, that is a signal to re-examine the design — perhaps something is over-specified, perhaps a genuine risk justifies the premium, perhaps a corner has been cut. The rate has done its job as a check without ever pretending to be the design.
The top-down mistake reverses this. Start from "offices cost X per square foot," multiply by the area, and you have produced a budget with no relationship to how long the boundary is, how many doors need control, or what the building holds. Sometimes it happens to land close; often it under-funds a building with an awkward perimeter or over-funds a simple one, and either way nobody has actually thought about the risk.
Where the metric fits among the others
Per square foot is one lens, and it is at its best alongside the others rather than alone:
- Per apartment or per unit normalises a residential project by household rather than area, which residents and committees find more intuitive; see the security cost per apartment guide.
- Per running metre is the right unit for the boundary, where cost genuinely tracks length; see the perimeter security cost guide.
- Lifecycle / total cost of ownership captures the running cost that a capex-per-square-foot number omits; see the security lifecycle cost guide.
Read together, these keep any single benchmark honest. Per square foot answers "is this total roughly sane for a building this size and type?" — a good question, as long as it stays a check and never becomes the design.
Key takeaways
- Security cost per square foot is total security spend divided by built-up or carpet area — a benchmark for sanity-checking and comparing budgets, never a formula for sizing a system.
- Area is not the true cost driver. Perimeter length, the number of entry points, occupancy and risk, and the systems chosen drive the cost; two buildings of equal area can differ two or three times over.
- The rate falls as buildings get larger, because a big floor plate dilutes fixed costs like the control room, head-end and gatehouse.
- It varies enormously by building type — a warehouse per square foot is tiny, a bank or jewellery showroom per square foot is high — so any single rate that ignores building type is close to meaningless.
- Separate capex per square foot from opex per square foot; the running cost, guarding above all, usually dwarfs the one-time build over a building's life.
- Design bottom-up from the real threat and layout, then use per square foot only to sanity-check the total — never start from a rate and multiply up.
- The bands here are wide, indicative and verify-locally; get at least three written, itemised quotes, and never trim life-safety or egress to hit a rate.
Where to go next
- The home security system cost guide (pillar) and the security cost planning guide — the method that turns risk into a budget.
- The security cost per apartment guide and the security lifecycle cost guide — the complementary per-unit and total-cost-of-ownership lenses.
- The perimeter security cost guide and the CCTV installation cost guide — pricing the pieces bottom-up.
- The security cost sub-hub and the main security hub.
References
- National Building Code of India (SP 7), Bureau of Indian Standards — means of egress, exit provisions and fire-safety requirements that take priority over any cost benchmark; verify the current edition (SP 7:2026) via the BIS catalogue: https://www.services.bis.gov.in/
- Digital Personal Data Protection Act, 2023 — CCTV footage, access logs and monitoring records hold personal data; agree in writing who may view them, retention periods and safeguards.
- Private Security Agencies (Regulation) Act, 2005 (PSARA) — guards, the largest running cost in most buildings, must be deployed through a registered agency and are priced per guard-shift, not per square foot.
- Goods and Services Tax (GST) — applies on top of equipment and services; confirm the applicable rate at the time of purchase, as every band in this guide is quoted before tax.
This is an educational, right-sizing overview for architects, developers, facility managers and security consultants — not legal, financial or installation advice. Per-square-foot bands are wide indicative benchmarks for sanity-checking a budget, not quotes; design bottom-up from the real threat and layout, obtain at least three written itemised quotes, deploy guards only through PSARA-registered agencies, protect personal data under the DPDP Act, never trim life-safety or egress to hit a rate, and verify any standard's current status via the BIS catalogue before relying on it.
Export this guide
Related Guides — Deep-dive reading
Complete Guide to Building Type Security in India (2026): Right-Sizing Protection to Homes, Schools, Hospitals, Warehouses and Temples
The same security building blocks — perimeter, gate and access, CCTV, alarms, lighting, fire, guards and cyber — are composed very differently for a villa, a school, a hospital, a warehouse or a temple. This pillar maps the whole library of building-type guides and gives you the framework to tailor security to each kind of building.
SecurityHome Security System Cost in India (2026): The Honest Budgeting Guide
There is no single price for a home security system — it is a stack of choices. This pillar gives you the mental model to budget the whole home: the cost drivers, the split between one-time capex and ongoing opex, wide indicative tier bands, a five-year total-cost lens, and how to read and compare quotes.
SecurityData Storage Cost for CCTV in India (2026): Local Disks vs Cloud, and How to Size It
The running cost people forget when they buy cameras. Where the footage actually lives — a one-time surveillance hard disk in the recorder, or a recurring per-camera cloud plan — and how camera count, resolution, frame rate, recording mode and retention days decide how many terabytes, and how much money, you really need.
SecurityRelated Tools — Try Free
CCTV Cloud vs Local Cost Calculator
Compare cloud CCTV subscription against a local NVR + HDD — upfront, 5-year total, monthly fee and break-even.
Cloud vs LocalApartment vs Villa Interior Planning Guide
Compare ceiling height, structural flexibility, lighting, storage, and services between apartments and villas.
Planning GuideCCTV Cable-Length Calculator
Total cable to buy for a CCTV job and a warning when a run exceeds the cable's maximum length.
Cable Length