
Residential Density Planning
Density demystified — dwelling units per hectare, FSI/FAR and ground coverage, the density gradient, the livability trade-off, and why the same FSI can yield very different forms
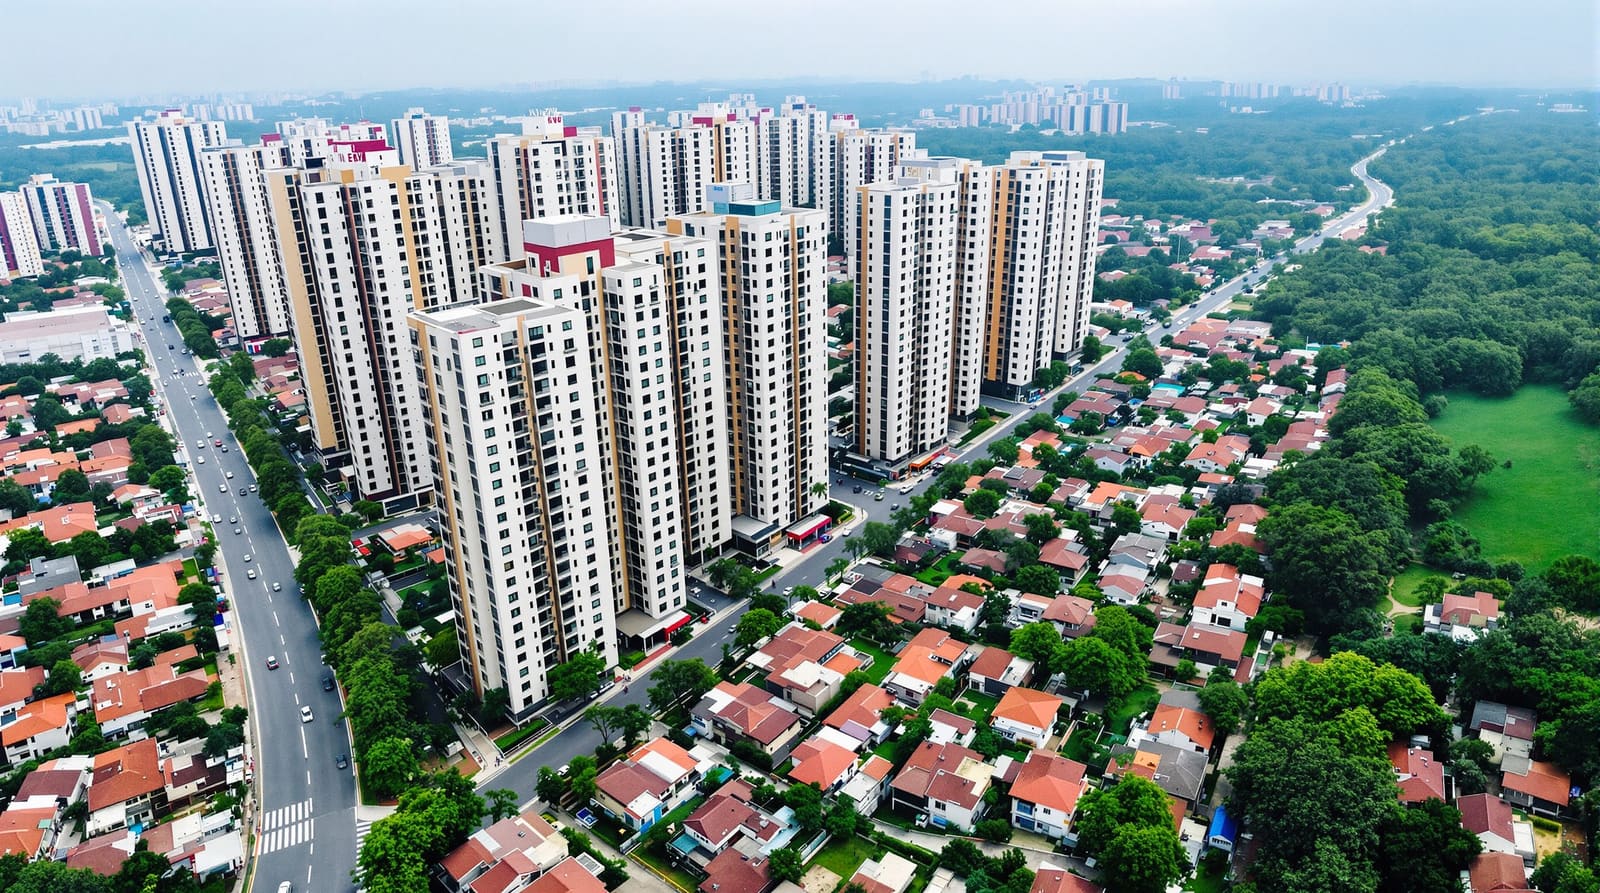
Drive into almost any new township on the fringe of an Indian metro — the eastern edge of Bengaluru, the new sectors of Gurugram, the outer growth corridors of Pune or Hyderabad — and you can read a development's density with your eyes before you ever see a sanction plan. Near the arterial road and the metro feeder there are eight- and fourteen-storey towers, their podiums lined with shops. Walk fifteen minutes inward and the towers give way to four-storey walk-up apartments, then to rows of independent houses on plots, then, right at the green belt, to large bungalows on generous plots with their own gardens. The skyline steps down like a staircase. That gradient is not an accident; somebody planned it, or, just as often, the market improvised it because nobody planned it well.
The word "density" frightens people. To a homeowner it sounds like crowding, traffic and water shortages; to a developer it sounds like more saleable area; to a planner it is the single dial that decides whether a neighbourhood will be walkable and serviceable or sprawling and starved of infrastructure. The trouble is that everybody argues about density using different yardsticks, and most of those yardsticks measure different things. Residential density is not one number but a small family of measures — and the same headline density can produce wildly different places, so the planner's real job is not to minimise or maximise density but to find the liveable middle and distribute it intelligently across the layout.
Four measures that people confuse for one
Before you can plan density you have to be precise about what you are counting. Four measures dominate the conversation, and they are not interchangeable.
Dwelling units per hectare (DU/ha) counts homes per unit of land. A layout at 75 DU/ha has, on average, 75 households living on each hectare (a hectare being 2.47 acres, or roughly the footprint of a small layout). This is the planner's favourite measure because it maps directly onto demand for services — water, sewage, school seats, parking — which scale with households, not with floor area.
Population density (persons per hectare) is DU/ha multiplied by average household size. With Indian household sizes commonly around four, a layout at 75 DU/ha carries roughly 300 persons per hectare. Population density is what infrastructure engineers actually size pipes and substations against.
Floor Space Index (FSI) — called Floor Area Ratio (FAR) in much of the world and in many Indian states — is the ratio of total built floor area to plot area. An FSI of 1.5 means you may build one-and-a-half times the plot's area in floor space, stacked over however many storeys the bye-laws allow. FSI controls intensity of construction, not number of homes: the same FSI can be filled with a few large flats or many small ones.
Ground coverage is the percentage of the plot that buildings actually sit on at ground level — the footprint. A 40 per cent ground coverage leaves 60 per cent of the plot as open ground, setbacks, parking and landscape. Ground coverage is the measure that decides how much sky and breathing room remains between buildings.

The relationships matter. FSI and ground coverage together imply height: an FSI of 2.0 at 25 per cent ground coverage means buildings average eight storeys, while the same FSI of 2.0 at 50 per cent coverage means four. DU/ha then depends on how that floor area is sliced into homes. The detailed arithmetic of computing FSI for a single building — deductions, exemptions, premium FSI, how staircases and balconies are treated — belongs to its own discipline, and we cover it in the FSI/FAR computation guide for architects. At the layout scale, treat FSI as the master regulator the authority hands you, and density as what you do with it.
Why the same density looks completely different
Here is the idea that catches most people out: two layouts can have identical FSI and nearly identical DU/ha and yet feel like different planets.
Imagine a hectare to be built at FSI 2.0. Option one is a single slender tower covering just 15 per cent of the ground, surrounded by a generous shared lawn — the classic "tower in a park" that Le Corbusier popularised and that dominates Indian gated high-rises. Option two is a tight grid of four-storey buildings covering 50 per cent of the ground, with narrow streets, courtyards and shopfronts — the "low-rise high-density" form you see in older parts of Pune, the inner lanes of Ahmedabad, or any well-loved European old town. Same FSI. Same number of homes, roughly. Utterly different experience of light, street life, privacy and walkability.

Neither is "right." The tower-in-a-park gives long views, breeze and big communal greens but produces dead ground-level frontages, total car dependence and lifts that fail. The low-rise high-density form gives lively, climbable, naturally ventilated streets — Jane Jacobs's "eyes on the street" — but demands disciplined design to keep lower floors from going dark. The lesson for the layout planner is that you cannot specify density and walk away; you must specify form — through ground-coverage limits, height caps, setbacks and frontage rules — or the same density number will betray you. How that built form is experienced from inside a home is the subject of urban home architecture in India.
The density gradient: not flat, but tuned
Good layouts are almost never one density throughout. They follow a density gradient — an idea formalised in New Urbanism as the Transect, running from the most intense urban core to the most rural edge. The principle is simple: put the most people where the infrastructure and amenities already are, and taper outward.
In practice that means the highest density — mid-rise and high-rise apartments, perhaps with shops at the base — sits along arterial roads, near the transit station, and around the neighbourhood centre. As you move into the interior, density steps down to walk-up apartments and row housing, then to plotted independent houses, and finally to the largest plots and lowest density along the green edge, the lake buffer or the agricultural boundary. This is exactly the staircase you read on the township drive.

The gradient does real work. It concentrates footfall where buses and metros need riders to be viable. It puts the most homes within a short walk of the shops and the station — the heart of the 15-minute-city argument — while still offering quieter, lower-density living for those who want it, all within one neighbourhood. It also matches traffic loads to road capacity: high-density blocks face the wide arterials built to carry their traffic, while the low-density interior keeps its lanes calm. How those densities translate into the actual mix of plot sizes — how many large plots, how many small, how many apartment parcels — is a distribution exercise covered in residential plot distribution; here we are setting the intensity, not the parcel sizes.
The honest trade-off, and the Goldilocks middle
Density has a U-shaped relationship with liveability, and pretending otherwise is dishonest. Both extremes are bad.
Too low and you get sprawl. Large plots and low DU/ha spread homes so thinly that every destination requires a car, public transport can never gather enough riders to run frequently, and the cost of laying and maintaining roads, water lines, sewers and electricity per household climbs steeply because there are so few homes to share each kilometre of pipe. Sprawl is also a quiet land glutton, eating farmland and lengthening commutes.
Too high and you get the opposite failure: crowding that overwhelms the infrastructure that was designed for fewer people, buildings packed so tight they steal each other's light and cross-ventilation, parking that overflows onto every lane, and open space squeezed to a token strip. Much of the misery blamed on "density" is really the misery of density without matching infrastructure, open space and form control.

The Goldilocks middle is the density that is high enough to make transit, shops and services viable and efficient, yet low enough that light, air, open space and infrastructure keep pace. What sets that middle is not ideology but four hard constraints: the infrastructure capacity (can the trunk water, sewerage and power actually serve these numbers?), the open-space provision (is there enough green and recreation per resident, covered in open space planning?), the parking demand and where it goes, and light and ventilation — the setbacks and spacing that keep flats habitable in an Indian summer. Get those four right and surprisingly high densities feel generous; get them wrong and modest densities feel oppressive. These principles tie back to the broader layout planning principles.
Indicative residential density bands
The numbers below are illustrative and vary widely by city, master plan and authority — treat them as a way to calibrate intuition, not as a regulation.
| Layout character | Typical DU/ha | Typical FSI/FAR | Typical ground coverage | Where it fits |
|---|---|---|---|---|
| Low-density plotted & bungalow | up to ~40 | ~1.0–1.5 | 40–50% | Green edge, premium plotted layouts |
| Medium-density row & walk-up | ~60–100 | ~1.5–2.0 | 35–45% | Layout interior, mid-gradient |
| High-density mid-rise apartments | ~120–200 | ~2.0–3.0 | 25–35% | Near collectors & neighbourhood centre |
| Very-high-density / TOD high-rise | ~200+ | ~3.0–4.0+ | 20–30% | Along transit corridors & arterials |
Read the table across, not down: notice how ground coverage falls as density rises, because the extra floor area goes up in height rather than out across the plot — that is what keeps light and open space alive at higher intensities.
In India: sanctioned density versus lived reality
Indian density is governed less by any single national rule than by the master plan and zonal plan of each Development Authority — DTCP in Haryana and Tamil Nadu's planning arm, BDA in Bengaluru, CMDA in Chennai, HMDA in Hyderabad, MCGM and the planning authorities in Mumbai, and their counterparts elsewhere. Each zone carries a permitted FSI/FAR and, often, a permitted density band, set out in the Development Control Regulations (DCR) and building bye-laws. A plotted layout must clear layout approval from the planning department before any plots can be sold, and — separately and later — each plot owner must obtain building-plan sanction for their individual house; the two approvals are distinct, and the URDPFI Guidelines frame the planning logic that underpins both. Plotted developments above the threshold size also require RERA registration, which has tightened the link between what is sanctioned and what is delivered.
The defining Indian story of the last decade has been the deliberate push for higher FSI around transit — Transit-Oriented Development (TOD) policies that grant premium FSI within a few hundred metres of metro corridors, precisely to build the density gradient that makes those expensive metro lines worth their cost. In principle this is exactly right. In practice three gaps recur. First, sanctioned density outruns lived infrastructure: FSI is raised but the trunk water, sewerage and roads lag, so the density that looks fine on paper produces tankers, sewage overflow and gridlock. Second, parking is chronically under-provided and spills onto streets, because real car ownership exceeds the bye-law's parking norm. Third, the gap between the approved master-plan density and what is actually built — through unauthorised additional floors, regularised violations and incremental densification — means the real load on a neighbourhood can drift well above what its pipes were sized for. Thoughtful density planning, then, is not just choosing a number; it is insisting that the infrastructure, open space and parking are sized for the density you are actually permitting, and that the gradient is honoured rather than flattened by a developer maximising saleable area everywhere at once.
Done well, density is not the enemy of a good neighbourhood — it is the engine of one. The right density makes the corner shop viable, the bus frequent, the walk to school short, the water line affordable per home, and the whole development more, not less, liveable. To see how all this fits into the full process of subdividing land, return to the pillar, how to design a residential layout in India, where density takes its place alongside streets, plots and open space.
References
1. Clarence Perry, The Neighbourhood Unit (Regional Survey of New York and Its Environs, 1929).
2. Jane Jacobs, The Death and Life of Great American Cities (Random House, 1961).
3. Jeff Speck, Walkable City: How Downtown Can Save America, One Step at a Time (Farrar, Straus and Giroux, 2012).
4. Kevin Lynch, The Image of the City (MIT Press, 1960).
5. URDPFI (Urban and Regional Development Plans Formulation and Implementation) Guidelines, 2014, Ministry of Urban Development, Government of India.
6. National Building Code of India, 2016 (Bureau of Indian Standards) — Part 3, Development Control Rules and General Building Requirements.
7. Relevant State Town and Country Planning Acts and Development Control Regulations (e.g. DTCP, BDA, CMDA, HMDA), as applicable to the layout's location.
See also our sibling guides on residential plot distribution and open space planning for residential layouts, and use DesignAI to model and visualise density scenarios for your own layout.
Export this guide
Related Guides — Deep-dive reading
How Urban Regulations Shape Cities in India
How the abstract rulebook of FAR, setbacks, height, parking and zoning literally builds the streets, skylines and neighbourhoods you live in
Building Regulations & ComplianceUnderstanding Building Bye-Laws in India: A Homeowner's Guide
What municipal building bye-laws are, who makes them, and how to find and read the ones that actually govern your plot
Building Regulations & ComplianceKanchanjunga Apartments: How Charles Correa Stacked the Indian Bungalow into the Sky
Charles Correa's 1983 tower on Cumballa Hill lifts the wrap-around verandah of the old Bombay bungalow twenty-eight storeys into the Mumbai air — a slender concrete shaft of interlocking split-level flats and double-height corner gardens that argues density and the private house were never enemies. A study of its central core, its cantilevered terraces, its climate logic, and the luxury critique the form invites.
The Future of ArchitectureRelated Tools — Try Free
Property Tax Calculator — 10 Indian Cities
Estimate annual municipal property tax across BBMP / MCD / MCGM / GHMC / GCC / KMC / PMC / AMC / TMC / PCMC — with self-occupied, tenanted, and age-rebate adjustments.
Property TaxInterior Layout Planner — Printable Graph Grid
Printable graph grid to sketch room layouts to scale before committing to furniture placement.
Layout ToolApartment Video Door System Planner
Enter flats, entrances, floors and guard desk for a first-pass building intercom plan — door stations, indoor monitors, guard station, the right architecture and an indicative cost band.
Building Planner