
Home Energy Monitoring: See Where Your Electricity Goes
You can't cut what you can't see — how home energy monitors reveal exactly where your power (and money) goes, the whole-home vs circuit-level vs smart-plug options, what they realistically save, and how to use the data to lower the bill.
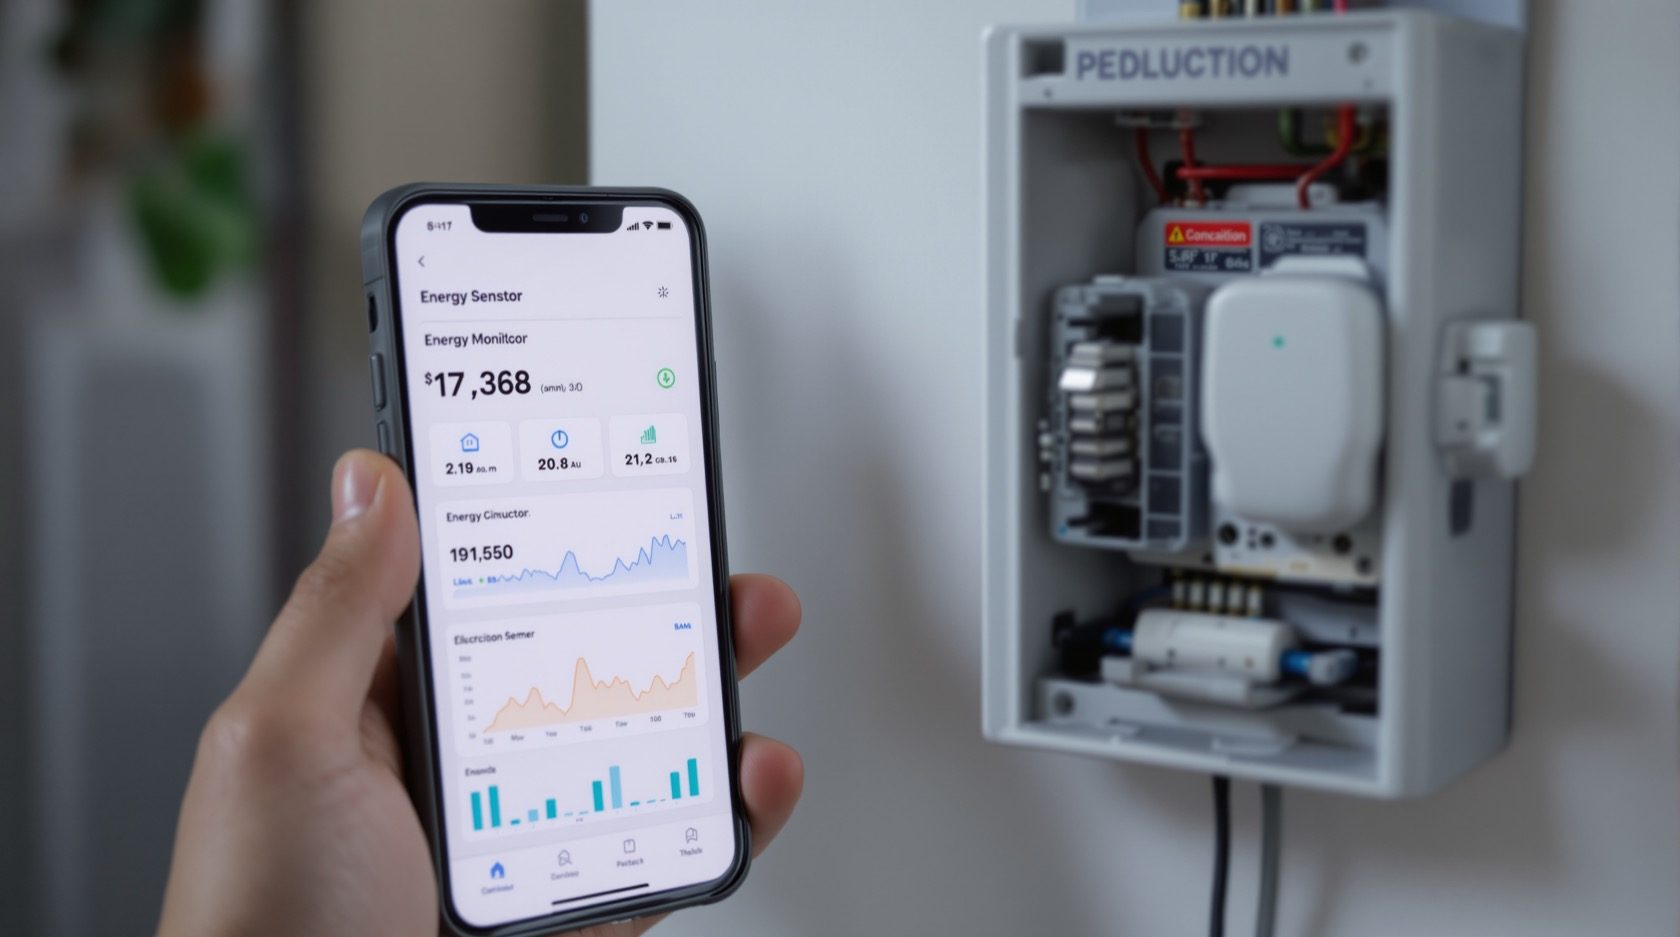
Most people have no idea where their electricity goes — the bill arrives, it's high, and the causes are invisible. Home energy monitoring changes that: a device that measures your consumption in real time and shows you, on an app, exactly what's using power and when. That visibility is genuinely useful, because you cannot cut what you cannot see — and once you can see it, the wasteful loads, the always-on drains and the expensive habits become obvious. This guide explains the options honestly, including what they really save.
It sits under the home energy management guide and complements smart meters.
The safety line. Whole-home and circuit-level monitors clamp onto or connect within the distribution board — installed by a licensed electrician. Smart plugs are user-installable consumer devices. This guide helps you choose; DB-level installation is professional.
The three levels of monitoring
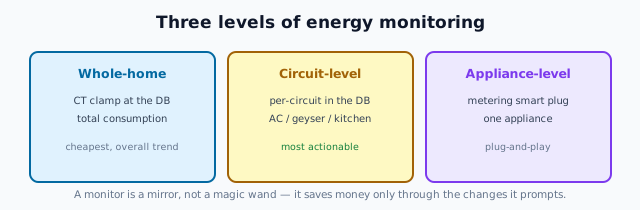
Energy monitoring comes at three granularities, from a single whole-home number to per-appliance detail:
| Level | Device | Shows | Install |
|---|---|---|---|
| Whole-home | CT-clamp monitor at the DB | Total home consumption in real time | Electrician (in the DB) |
| Circuit-level | Multi-channel monitor at the DB | Consumption per circuit (kitchen, AC, geyser…) | Electrician (in the DB) |
| Appliance-level | Smart plug with metering | One appliance's consumption | Plug-and-play |
- Whole-home monitors clamp a current transformer (CT) around the incoming cable and report total consumption — the cheapest way to see your overall use and trends.
- Circuit-level monitors measure each circuit separately, revealing which parts of the home use most (the AC, the geyser, the kitchen) — far more actionable.
- Smart plugs with energy metering measure a single appliance — perfect for hunting a specific power drain (an old fridge, a set-top box left on).
What you actually learn
Good monitoring reveals things that are otherwise invisible:
- The always-on baseline — the "phantom" load of devices on standby, chargers, set-top boxes and idle electronics that runs 24×7 and quietly adds up.
- The big consumers — usually the AC, geyser, and any resistive heater; seeing their share tells you where efficiency (or behaviour) matters most.
- Expensive habits — a geyser left on, an AC running in an empty room, an old appliance drawing far more than a new one.
- The effect of changes — swap a light or an AC and see the difference, which turns efficiency from guesswork into evidence.
What it realistically saves
Here's the honest part, because monitors are sometimes oversold:
- A monitor doesn't save energy by itself — it saves energy by changing what you do with the information. The device shows; you must act.
- The typical, realistic saving comes from the behaviour changes the data prompts: killing phantom loads, running heavy appliances less wastefully, replacing the worst energy hogs, shifting usage. Many households cut a meaningful slice of the bill this way — but only if they use the insight.
- The value is highest where the bill is high, usage is opaque, and you're willing to act on what you learn; lowest if you already run an efficient, well-understood home.
An energy monitor is a mirror, not a magic wand. It makes waste visible; cutting it is up to you. Its payback comes from the actions it inspires, not from owning the device.
Using the data to cut the bill
Once you can see your consumption:
- Find and kill the phantom baseline — switch off or unplug always-on drains, use smart plugs to schedule them off.
- Target the big consumers — right-size and efficient-star the AC and geyser (see energy management); run them smarter.
- Replace the hogs — the data justifies replacing an old, inefficient appliance with a BEE-rated one.
- Shift usage where a time-of-day tariff or smart meter rewards it — run heavy loads in cheaper windows.
- Track and confirm — watch the bill fall and keep adjusting.
The one-line answer
Home energy monitoring shows you, in real time, exactly where your electricity goes — at whole-home level (a CT clamp at the DB), circuit level (per-circuit, the most actionable), or appliance level (a metering smart plug) — revealing the always-on baseline, the big consumers and the expensive habits that are otherwise invisible. But be honest: a monitor is a mirror, not a magic wand — it saves money only through the behaviour changes and upgrades the data prompts, so its real payback comes from acting on what you see, especially where the bill is high and you're willing to change habits.
Where to go next
- Managing the whole picture: Home Energy Management Guide.
- The utility's smart meter: Smart Meters Guide.
- Efficient lighting/appliances: LED Lighting Guide.
- The smart-home foundation: Smart Home Wiring Guide.
References
- IS 16444 (Parts 1 & 2), AC Static Watthour Smart Meter — Specification, Bureau of Indian Standards.
- Bureau of Energy Efficiency, Standards & Labelling programme: https://beeindia.gov.in/
- IS 732 : 2019, Code of Practice for Electrical Wiring Installations; National Electrical Code SP 30 : 2023, BIS: https://www.bis.gov.in/
Savings depend entirely on the actions taken in response to the data; figures are indicative. DB-level monitors must be installed by a licensed electrician. Verify any standard's status via the BIS catalogue before relying on it.
Export this guide
Related Guides — Deep-dive reading
Home Energy Management: Cut the Bill Without Cutting Comfort
The practical playbook for lowering a home's electricity bill — efficient appliances and the BEE star rating, killing phantom loads, shifting usage to cheaper time-of-day windows, managing peak demand, and the power-quality issues that quietly cost you.
Electrical & WiringResidential Electrical Systems: The Complete Guide for Indian Homes
How the electricity in an Indian home actually works — from the utility supply and meter through the distribution board, circuits, wiring, earthing and protection, to lighting, safety, energy efficiency, smart controls, solar and backup — written so a homeowner can understand, plan and judge it, and know exactly where a licensed electrician must take over.
Electrical & WiringSmart Home Energy Management in India: Metering, Solar, EV & Load Control
As DISCOM smart meters, time-of-day tariffs, rooftop solar and EV charging arrive together, the Indian home becomes a small power system you can actually manage. A practical, rupee-first guide to seeing, shifting and shrinking your electricity bill.
Smart HomeRelated Tools — Try Free
Electrical Safety & Load Audit
Home electrical audit — 10 categories, 65+ checkpoints across earthing, RCCB, MCB, wiring, switchboards, appliance circuits, DG/inverter backup.
Safety AuditElectrical Load Calculator
Estimate a home's connected load and realistic maximum demand from its appliances, whether it needs single or three-phase supply, and a suggested main switch rating.
ElectricalRoom Lighting Calculator
Estimate the target lux, total lumens and number of LED fixtures a room needs, from its type and size — a general-illumination planning guide.
Lighting