
B.Arch CurriculumFree, forever
A tribute to Amogh N P
GIS Modelling in Urban & Regional Planning
A planner's most powerful question is 'where' — and a Geographic Information System is how that question is answered with data. This computer-lab elective builds the planner's GIS toolkit from the ground up: what a GIS really is (not a digital map, but a system that links a place to its data and lets you analyse both), how the world is captured as spatial data in two rival models — vector and raster — and joined to the attribute tables that describe it, how spatial analysis combines layers through overlay to ask new questions, and how all of it builds the planner's signature models — land-suitability analysis and urban land-use modelling that decide where a city should and should not grow. Learn to read the map, build the data, run the overlay, and model the city. The map stops being a picture and becomes an argument you can test.
Course byAmogh N P· Architect & interior designer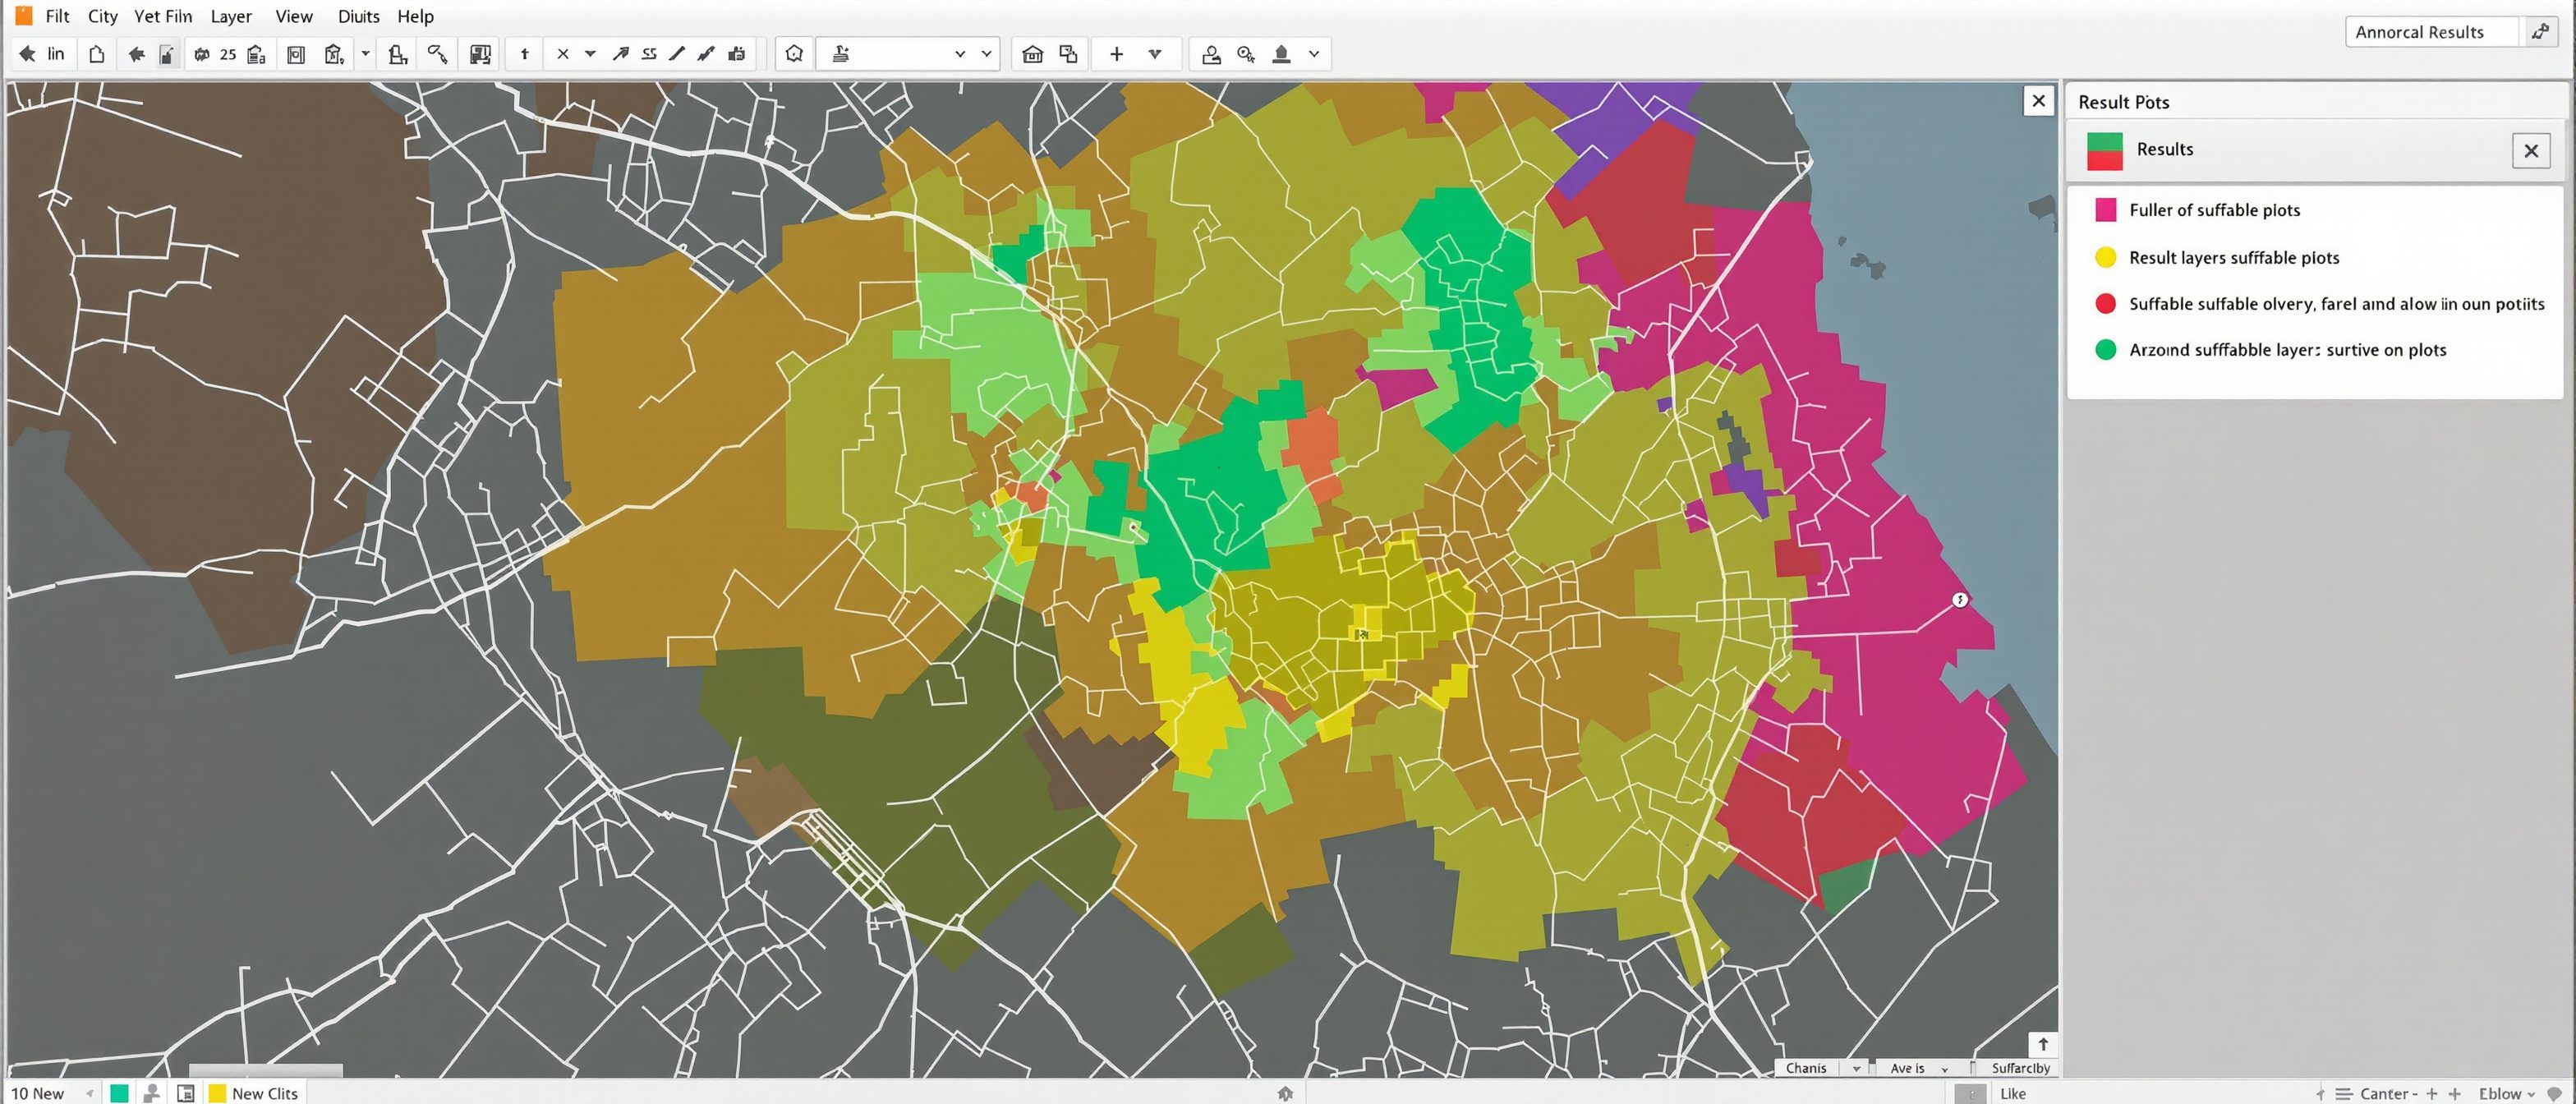
The syllabus
5 units · 5 liveTranscribed from the official B.Arch syllabus. All 5 units are live as full interactive lessons, each with original diagrams, a self-assessment quiz and a lab task.
Unit 1 — Introduction to GIS
LiveWhat a GIS is — capturing, storing, analysing and displaying spatially referenced data in layers; map and map analysis and automated cartography; the history and development of GIS; system concepts and hardware; coordinate systems and projections; and the standard GIS packages a planner uses.
Unit 2 — Spatial Data Input
LiveDefining the GIS planning problem; the types of data — spatial and non-spatial; the two great data structures, VECTOR (points, lines, polygons) and RASTER (a grid of cells); files, databases and data formats; data entry by digitizer and scanner; and data compression.
Unit 3 — Attribute Data Input
LiveThe role of attribute data in defining geographic features — geometry plus a table; adding an attribute data file and joining it to its geographic features by a key; TOPOLOGY generation — encoding the spatial relationships (adjacency, connectivity, containment); and satellite images as a data input to GIS.
Unit 4 — Spatial Analysis Using GIS
LiveThe analytical heart — OVERLAY functions that combine layers to ask new questions; manipulating attribute data and GIS modelling; GIS data processing (digitization, topology building, metadata creation); automated mapping and facility management (AM/FM); and map and report generation.
Unit 5 — Urban Land-Use Modelling
LiveThe planner's payoff — the need for a model; LAND-SUITABILITY ANALYSIS by weighted overlay (where should a use go?); urban land-use modelling; and change and demand modelling that forecasts how a city's land use will shift.
Course outcomes
What you will be able to doExplain what a GIS is — maps, cartography, coordinate systems and packages.
Build spatial data input — vector and raster, data structures and entry.
Add attribute data, generate topology and join data to features.
Perform spatial analysis — overlay, AM/FM and map and report generation.
Build urban land-use and land-suitability models.
Interpret GIS data and judge a model's assumptions.
The author
Amogh N P
Architect, interior designer, and creative polymath. Studio Matrx began in his notebooks — his vision of design made honest, useful, and open to everyone. Its Academy is written and taught in his memory, and free, forever.
More about Amogh →The map becomes an argument.
What a GIS is, vector/raster data, attributes and topology, overlay analysis, and land-suitability modelling. Read the five units, study the diagrams, then test yourself.
The curriculum is free, forever