
Spatial Data Input
Vector vs raster — the two ways to hold the world.
Before you can analyse, you must get the world INTO the GIS — and there are two rival ways to hold it. Learn the difference between spatial data (the geometry) and non-spatial data (the attributes); and the two great data structures — VECTOR (points, lines, polygons) and RASTER (a grid of cells). Learn how data is entered — by digitizer and scanner — held in files and databases, and compressed. Try the data-model explorer.
Learning objectives
By the end of this lesson, you will be able to — mapped to the course outcomes for GIS Modelling in Urban & Regional Planning:
Define a GIS planning problem and the data it needs.
Distinguish spatial from non-spatial data.
Compare the vector and raster data structures.
Explain data entry by digitizer and scanner, and data compression.
Spatial data & the two structures
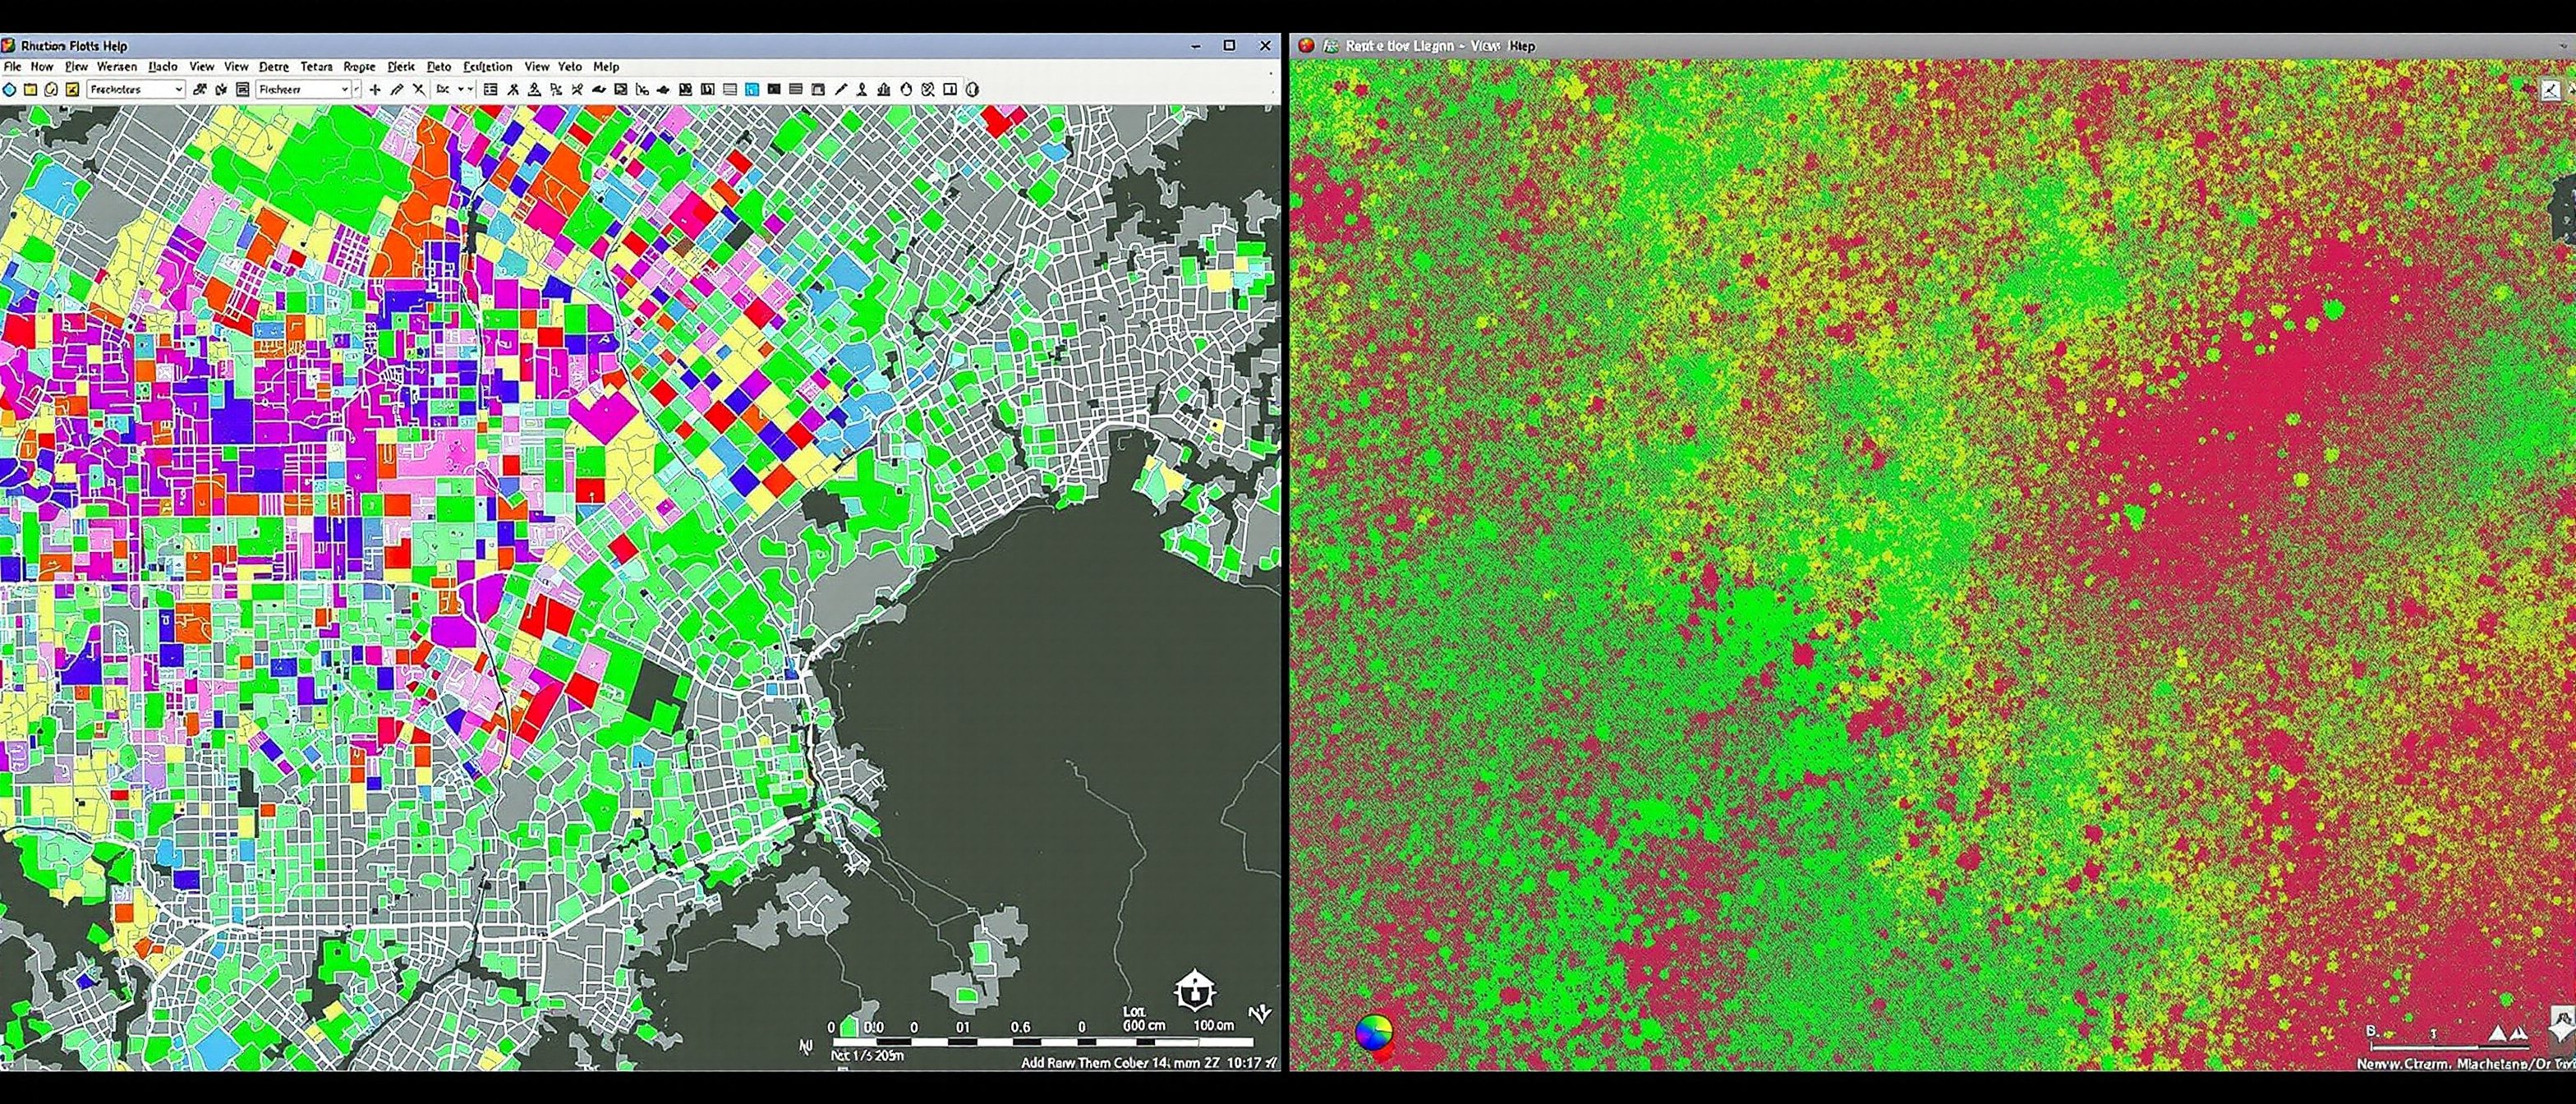
GIS data has a where (geometry) and a what (attributes); vector holds discrete features as points/lines/polygons, raster holds the world as a grid of cells — neither is better, match it to the data.[1, 2]
The where and the what
GIS data has two halves. SPATIAL (geometric) data is the WHERE — the coordinates that locate a feature on the earth. NON-SPATIAL (attribute) data is the WHAT — the table of facts about it (a plot's owner, area, land use, value). The power of GIS is that it BINDS them: select a plot on the map and read its data, or query the data and see which plots light up. Defining a GIS planning PROBLEM means deciding the QUESTION first, then what spatial and attribute data you need to answer it. MISCONCEPTION→correct: 'GIS data is just the map' — half of every GIS dataset is the attribute TABLE; without it the geometry is mute.[1]
Compare the structures
Pick vector or raster and read what it is, what it is best for, and its limit — and see why each suits different planning data.
Vector or raster · pick one
Vector
Features as POINTS, LINES and POLYGONS with exact coordinates — a well as a point, a road as a line, a plot as a polygon.
Best for: Discrete features with precise boundaries — plots, roads, buildings, administrative areas.
Limit: Awkward for continuous surfaces (elevation, temperature) and heavier to analyse cell-by-cell.
Neither is better — match the structure to the data: vector for discrete features, raster for continuous surfaces.
Getting data in
Data enters by digitizing, scanning, GPS and imagery, each georeferenced to align; it lives in files and databases and is often compressed — and the format and organisation matter.[1, 3]
Digitize, scan, import
Spatial data enters a GIS several ways. DIGITIZING traces features into vector form — historically on a DIGITIZER tablet, now usually ON-SCREEN over an image. SCANNING turns a paper map into a raster image (then georeferenced, and optionally digitized). Data also arrives from GPS surveys, satellite/aerial imagery, and existing digital datasets. Each must be GEOREFERENCED to the right coordinate system to align with other layers. MISCONCEPTION→correct: 'a scanned map is GIS data' — a scan is just a picture until it is georeferenced and (for vector work) digitized into features with attributes; capture is the slow, costly, error-prone heart of GIS.[1]
At a glance
| Aspect | Detail | Note |
|---|---|---|
| Vector | Points / lines / polygons | Discrete, precise — plots, roads |
| Raster | Grid of cells | Continuous, imagery — elevation, satellite |
| Spatial data | The geometry (where) | On the earth |
| Attribute data | The table (what) | Half of every dataset |
| Capture | Digitize / scan / GPS / imagery | The slow, costly heart |
Key terms
The geometry (where) and the attribute table (what).
Points, lines, polygons with exact coordinates — discrete features.
A grid of equal cells, each a value — continuous surfaces, imagery.
Tracing features into vector form, on a tablet or on-screen.
Turning a paper map into a raster and tying it to coordinates.
Shapefile, geodatabase, GeoTIFF, .dbf — what software can read and share.
Lab task
For each of these, say whether you would store it as vector or raster and why: city plots, ground elevation, the road network, a satellite image, rainfall. Then describe the steps to turn a scanned paper master plan into a usable GIS layer.
Self-assessment
1. Continuous data such as ground elevation or rainfall is best held as —
2. In GIS, the attribute data is —
3. A scanned paper map becomes usable GIS data only after it is —
Recap
References & further reading
- [1]ESRI, Understanding GIS — spatial vs attribute data, vector and raster, data capture.
- [2]Maguire, Batty & Goodchild, GIS, Spatial Analysis and Modeling — data structures.
- [3]OGC / QGIS documentation — GIS file and data formats, compression and databases.
Further reading
- ESRI — Understanding GIS.
- Maguire, Batty & Goodchild — GIS, Spatial Analysis and Modeling.
- C. D. Tomlin — Geographic Information Systems and Cartographic Modeling.
Sources gathered and fact-checked June 2026. Published values vary by source, sample and method — treat as indicative and confirm against the cited standard before structural use.
The author
Amogh N P
Architect, interior designer, and creative polymath. Studio Matrx began in his notebooks — his vision of design made honest, useful, and open to everyone. Its Academy is written and taught in his memory, and free, forever.
More about Amogh →