
Attribute Data Input
The table behind the map — and topology.
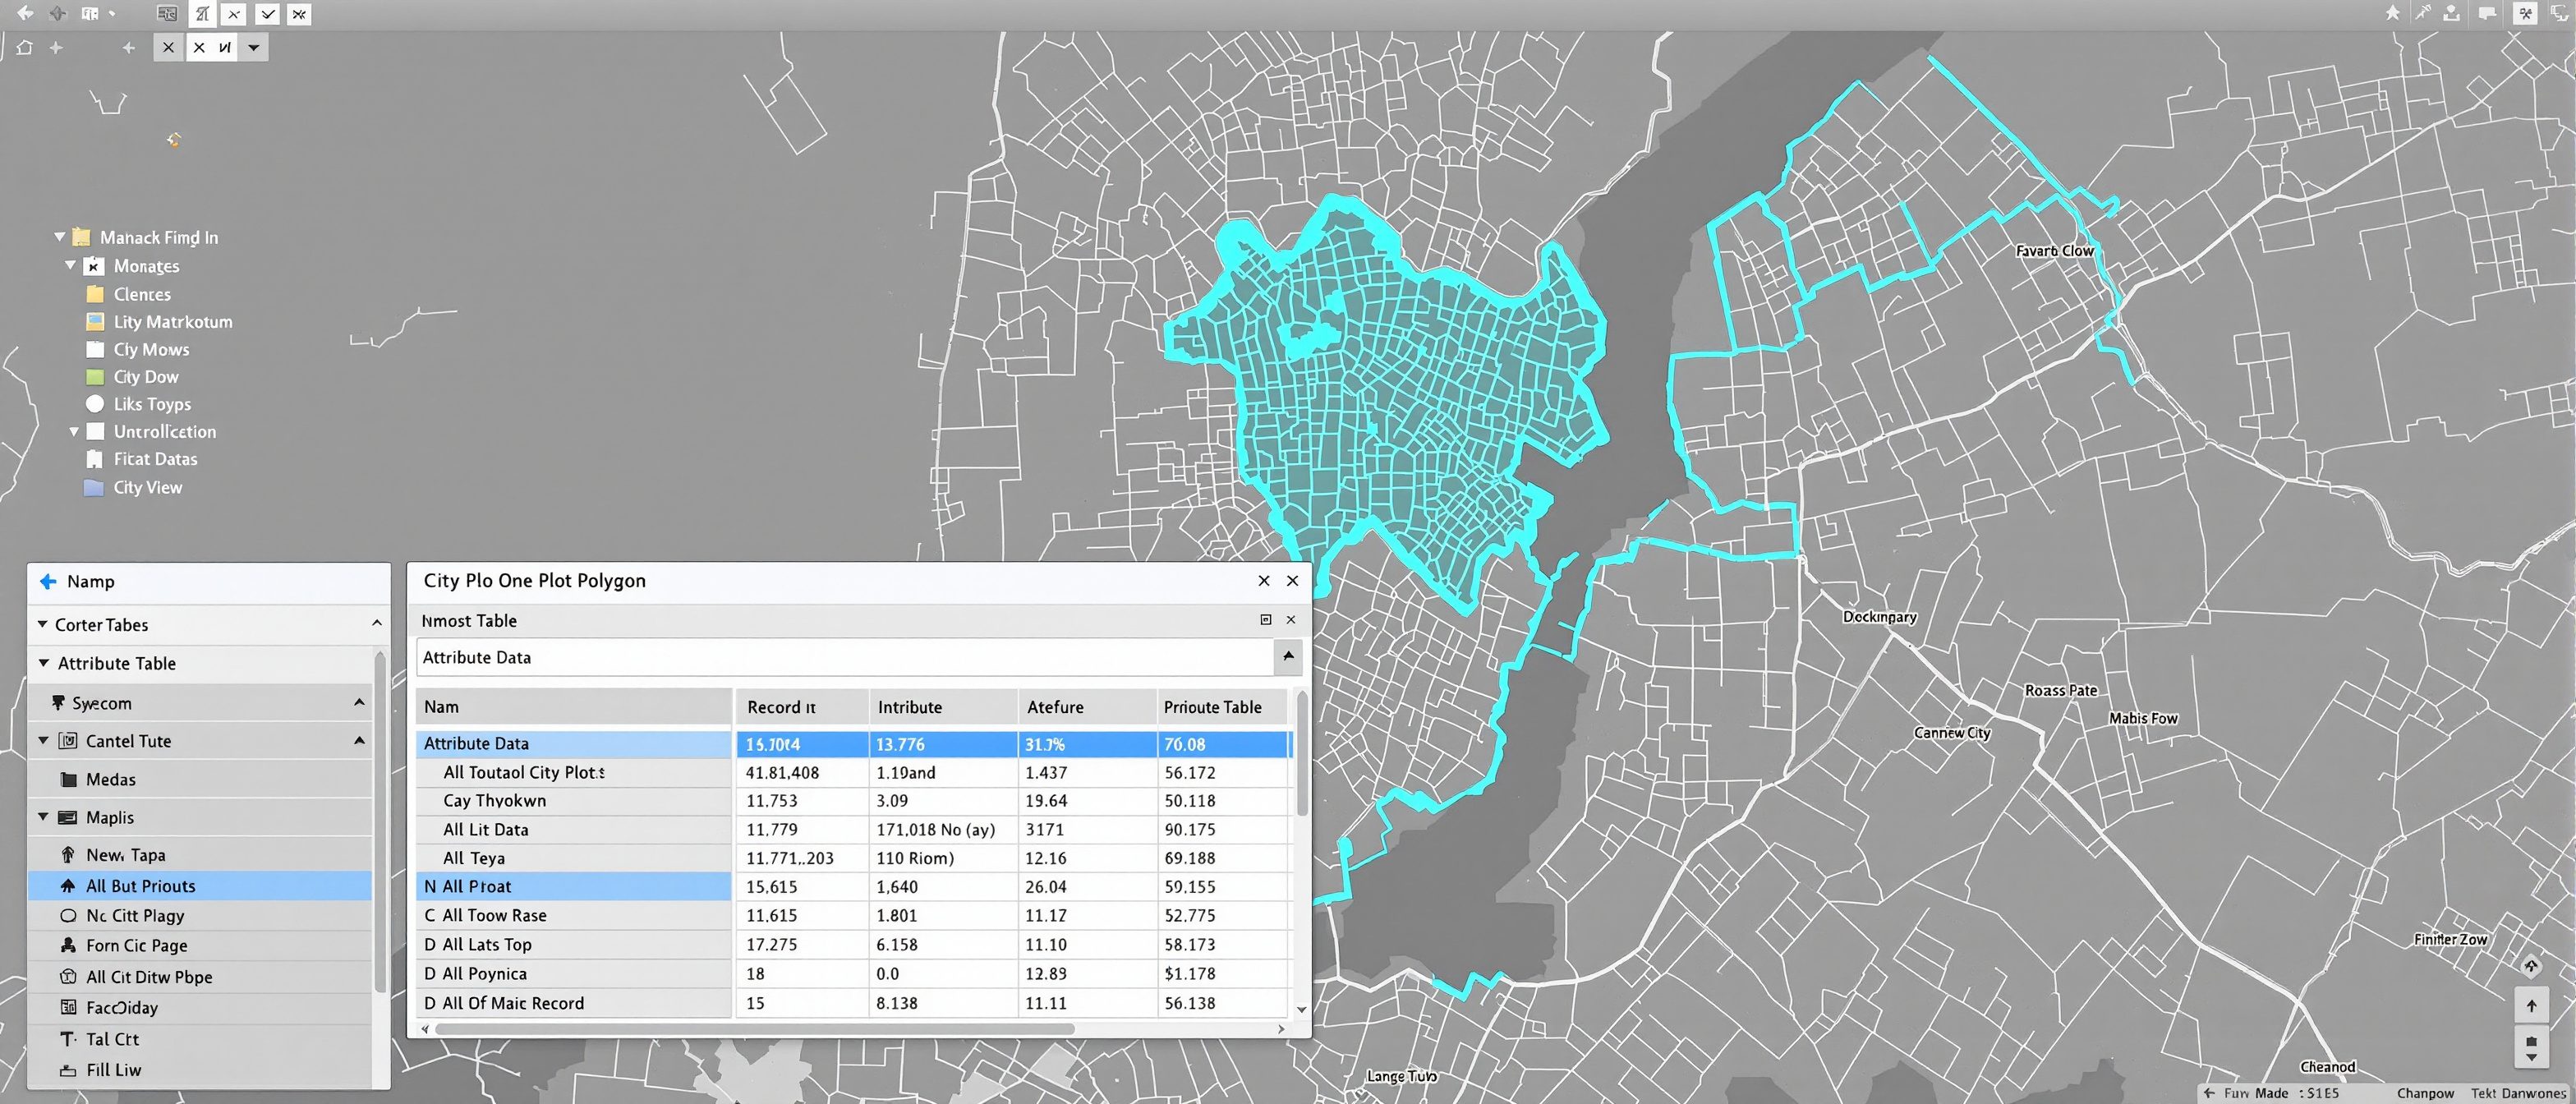
Geometry alone is a dumb drawing; the attribute data makes a GIS intelligent. Learn the role of attribute data — a plot is a polygon PLUS a row of data; how to join an attribute table to its features by a shared key, so a census spreadsheet becomes a coloured map; topology generation — encoding the spatial relationships between features so the GIS can reason; and satellite images as a rich, current input.
Learning objectives
By the end of this lesson, you will be able to — mapped to the course outcomes for GIS Modelling in Urban & Regional Planning:
Explain the role of attribute data in defining a feature.
Join an attribute table to its geographic features by a key.
Explain topology generation and the relationships it encodes.
Explain satellite images as an input to GIS.
The table behind the map
A feature is geometry plus an attribute row — the table is where the intelligence lives; a join links a separate table by a key, turning a census spreadsheet into a thematic map.[1]
What makes a feature
A geographic FEATURE in a GIS is geometry PLUS a row of attribute DATA. A plot is not just a polygon — it is a polygon bound to a record: owner, area, land use, value, FSI. The attribute TABLE is where the intelligence lives; it is what you query, classify and map by. Strip the table away and the GIS is just a drawing. MISCONCEPTION→correct: 'the map is the GIS' — the map is the visible tip; the ATTRIBUTE TABLE behind it is what makes a GIS answer 'show me every commercial plot over 500 m² with no completion certificate', which is the whole point.[1]
Topology & satellite input
Topology encodes spatial relationships — adjacency, connectivity, containment — so the GIS can reason; and satellite imagery is a current raster that becomes a usable layer once georeferenced and classified.[2, 3]
How features relate
TOPOLOGY is the GIS's encoding of the spatial RELATIONSHIPS between features — independent of their exact coordinates. It records ADJACENCY (which polygons share a border), CONNECTIVITY (whether the road or pipe network actually links up), and CONTAINMENT (whether a plot lies inside a ward). Topology lets the GIS REASON spatially — trace a network, find neighbours, detect gaps and overlaps — and enforces data quality (no slivers, no dangling lines). MISCONCEPTION→correct: 'if it looks right on screen it is right' — two roads can appear to meet but not be topologically CONNECTED; topology generation is what makes spatial relationships real to the computer, not just visible to the eye.[1, 2]
At a glance
| Aspect | Detail | Note |
|---|---|---|
| A feature | Geometry + attribute row | A polygon plus its data |
| The intelligence | The attribute table | What you query and map by |
| The join | Table → features by key | Census/survey becomes a map |
| Topology | Adjacency, connectivity, containment | Lets the GIS reason spatially |
| Satellite image | Raw raster | A layer once georeferenced/classified |
Key terms
The row of data bound to each feature — where the GIS intelligence lives.
Geometry plus an attribute record — a polygon plus its data.
Linking a separate table to features by a shared key — no re-keying.
Encoded spatial relationships — adjacency, connectivity, containment.
Whether a network truly links up — not just looks joined.
Current raster of the ground; a GIS layer once georeferenced/classified.
Lab task
Take a ward-boundary layer and a census table of population by ward. Describe the JOIN: what is the shared key, and what thematic map can you make once joined? Then give one example each of adjacency, connectivity and containment in your city, and explain why two roads that look joined on screen may not be topologically connected.
Self-assessment
1. A geographic feature in a GIS is —
2. Joining a census spreadsheet to ward boundaries by ward code lets you —
3. Topology in a GIS encodes —
Recap
References & further reading
- [1]ESRI, Understanding GIS — attribute data, joins and the geometry-plus-table feature model.
- [2]Maguire, Batty & Goodchild + Tomlin — topology and spatial relationships.
- [3]Remote-sensing / satellite-imagery references — classification and imagery as GIS input.
Further reading
- ESRI — Understanding GIS.
- C. D. Tomlin — Geographic Information Systems and Cartographic Modeling.
- Fotheringham & Rogerson — Spatial Analysis and GIS.
Sources gathered and fact-checked June 2026. Published values vary by source, sample and method — treat as indicative and confirm against the cited standard before structural use.
The author
Amogh N P
Architect, interior designer, and creative polymath. Studio Matrx began in his notebooks — his vision of design made honest, useful, and open to everyone. Its Academy is written and taught in his memory, and free, forever.
More about Amogh →