
Urban Land-Use Modelling
Suitability analysis — where should the city grow?
Everything builds to the planner's payoff: using GIS to MODEL the city. Learn why we need a model; land-suitability analysis — the GIS classic, descended from McHarg, where each factor becomes a layer, is rated, weighted by importance and overlaid into a suitability surface that says where a use should go; urban land-use modelling; and change/demand modelling. The model never decides — but it makes the planner's reasoning explicit and testable. Try the suitability-overlay explorer.
Learning objectives
By the end of this lesson, you will be able to — mapped to the course outcomes for GIS Modelling in Urban & Regional Planning:
Explain the need for a model in planning.
Build a land-suitability analysis by weighted overlay.
Explain urban land-use and change/demand modelling.
Judge a model's weights and assumptions.
Why model & suitability analysis
A model lets the planner reason about an unbuilt future; land-suitability analysis rates each factor, weights it by importance and overlays them into a suitability surface — and the weights are value judgments, made explicit.[1, 2]
Reasoning about the unbuilt
Planning is about a FUTURE that does not yet exist, so the planner needs a MODEL — a simplified, explicit representation of how the city works or could work — to reason about it. A GIS model lets you test 'what if' on data instead of on the ground: where could housing go, what land is at risk, how might use shift? MISCONCEPTION→correct: 'a model predicts the future' — a planning model EXPLORES and COMPARES possibilities and makes assumptions explicit; it is a reasoning aid, not a crystal ball. Its value is making the planner's logic visible and testable.[1]
Weight the factors
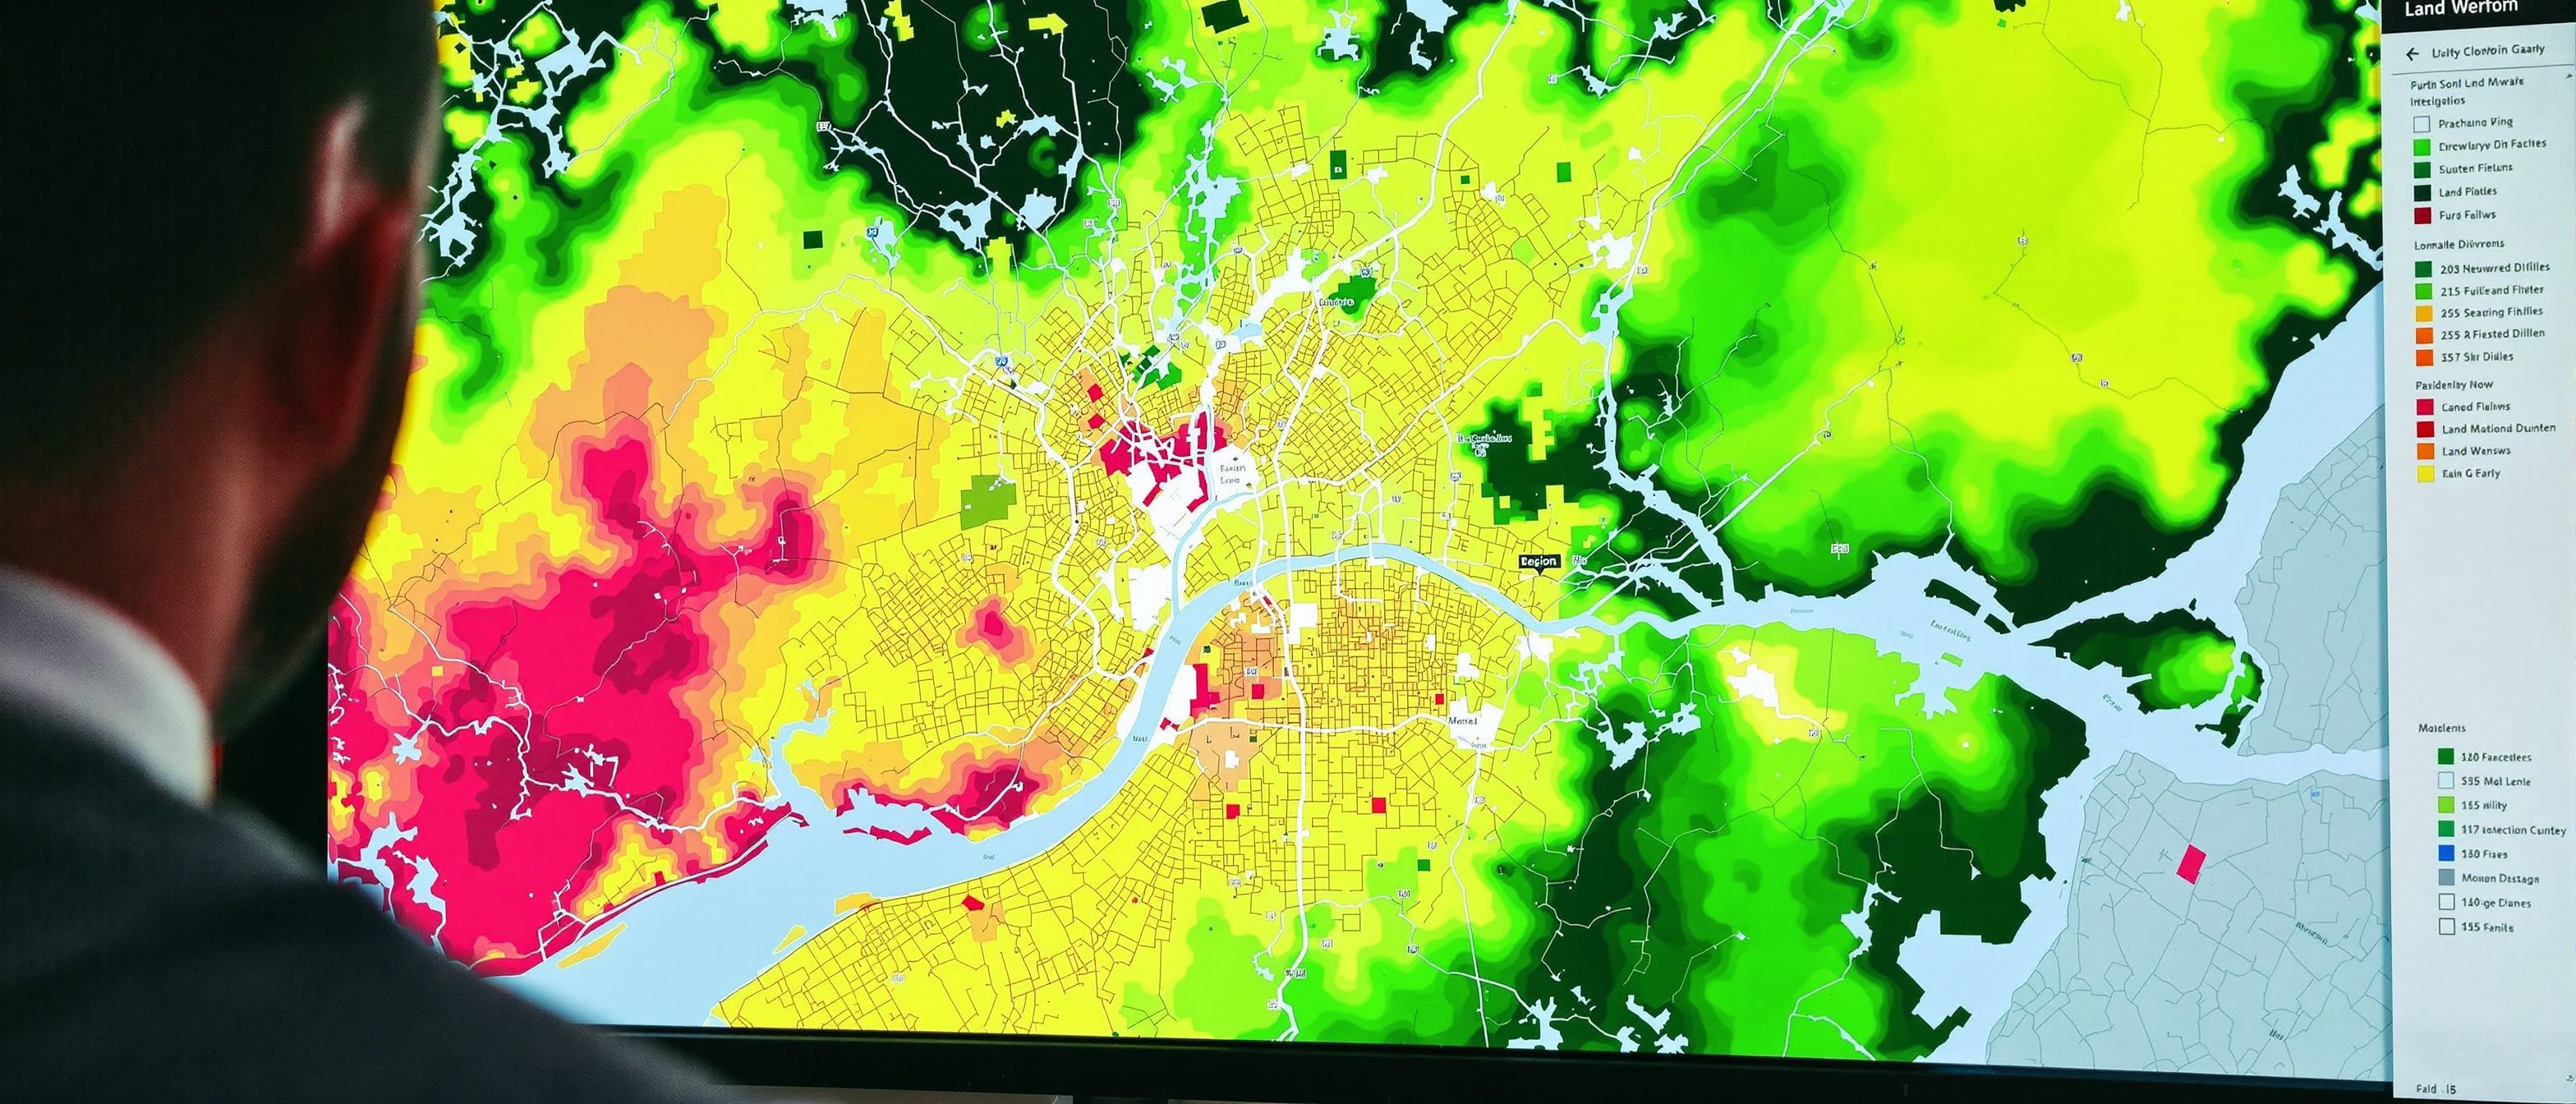
Set the weight of each factor — road access, slope, services, flood — and watch the suitability surface shift; see how the weights you choose (your values) decide where the model says a use should go.
Land-suitability · weight the factors
The overlay is driven most by "road access" — change the weights and the suitable land shifts. That choice of weights is a value judgment, not an objective fact.
Rate → weight → overlay = a suitability surface. The weights are the planner's values made explicit, not removed.
Urban modelling & the planner's judgment
Beyond suitability, GIS allocates and forecasts land use; but a model informs the plan with evidence and scenarios — the decision, weighing values, law and community, stays human.[3, 1]
Allocating and forecasting
Beyond suitability, GIS supports URBAN LAND-USE modelling — allocating uses (residential, commercial, industrial, green) across a city consistent with suitability, demand and policy — and CHANGE / DEMAND modelling, which forecasts how land use will SHIFT as population and economy grow (where will the built-up edge be in 20 years?). These range from simple GIS overlays to advanced spatial models, but all rest on the data and analysis built in this course. MISCONCEPTION→correct: 'the model gives the master plan' — a model INFORMS the plan with evidence and scenarios; the plan is a political and design decision that weighs the model against values, law and community, which GIS cannot.[3]
At a glance
| Aspect | Detail | Note |
|---|---|---|
| Why a model | Reason about the unbuilt future | Explore, not predict |
| Suitability method | Rate → weight → overlay | A suitability surface |
| The weights | Value judgments | Explicit, not objective |
| Change modelling | Forecast land-use shift | Informs, doesn't fix, the plan |
| The decision | GIS informs | People decide (values, law, design) |
Key terms
A simplified, explicit representation to reason about a future city.
Rate, weight and overlay factors to find where a use should go.
Combining reclassified factor layers by importance into a suitability surface.
Putting each factor onto a common suitability scale (e.g. 1–5).
Forecasting how a city's land use will shift as it grows.
The model makes reasoning explicit; the choice stays human.
Lab task
Build a land-suitability model (on paper or in QGIS) for a new residential township: list four factor layers, the suitability rating you would give each, and the weights. Use the explorer to test two weightings and note how the suitable land changes. Then write two sentences on why the result is not "objective", and why GIS still makes the analysis better.
Self-assessment
1. In a land-suitability analysis, the WEIGHTS given to each factor are —
2. Land-suitability analysis produces a result by —
3. The honest view of GIS in planning is that it —
Recap
References & further reading
- [1]Ian McHarg, Design with Nature + ESRI suitability-modelling method — weighted overlay land-suitability analysis.
- [2]C. D. Tomlin, Geographic Information Systems and Cartographic Modeling — the modelling method behind suitability.
- [3]Maguire, Batty & Goodchild + Brail, GIS in Urban and Regional Planning — urban land-use and change modelling.
Further reading
- Ian McHarg — Design with Nature.
- Maguire, Batty & Goodchild — GIS, Spatial Analysis and Modeling.
- R. K. Brail — Integrating GIS into Urban and Regional Planning.
Sources gathered and fact-checked June 2026. Published values vary by source, sample and method — treat as indicative and confirm against the cited standard before structural use.
The author
Amogh N P
Architect, interior designer, and creative polymath. Studio Matrx began in his notebooks — his vision of design made honest, useful, and open to everyone. Its Academy is written and taught in his memory, and free, forever.
More about Amogh →