
Introduction to GIS
Not a digital map — a system that links place to data.
A Geographic Information System is widely mistaken for "a digital map". It is far more: a system that links every place to its data and lets you ANALYSE both — the planner's instrument for the question "where". Learn what a GIS really is and how it stores the world in layers; map analysis and automated cartography; coordinate systems and projections (and why you cannot flatten a sphere without distortion); and the standard GIS packages.
Learning objectives
By the end of this lesson, you will be able to — mapped to the course outcomes for GIS Modelling in Urban & Regional Planning:
Explain what a GIS is and how it stores the world in layers.
Explain map analysis and automated cartography.
Explain coordinate systems and projections.
Identify the standard GIS packages.
What a GIS is
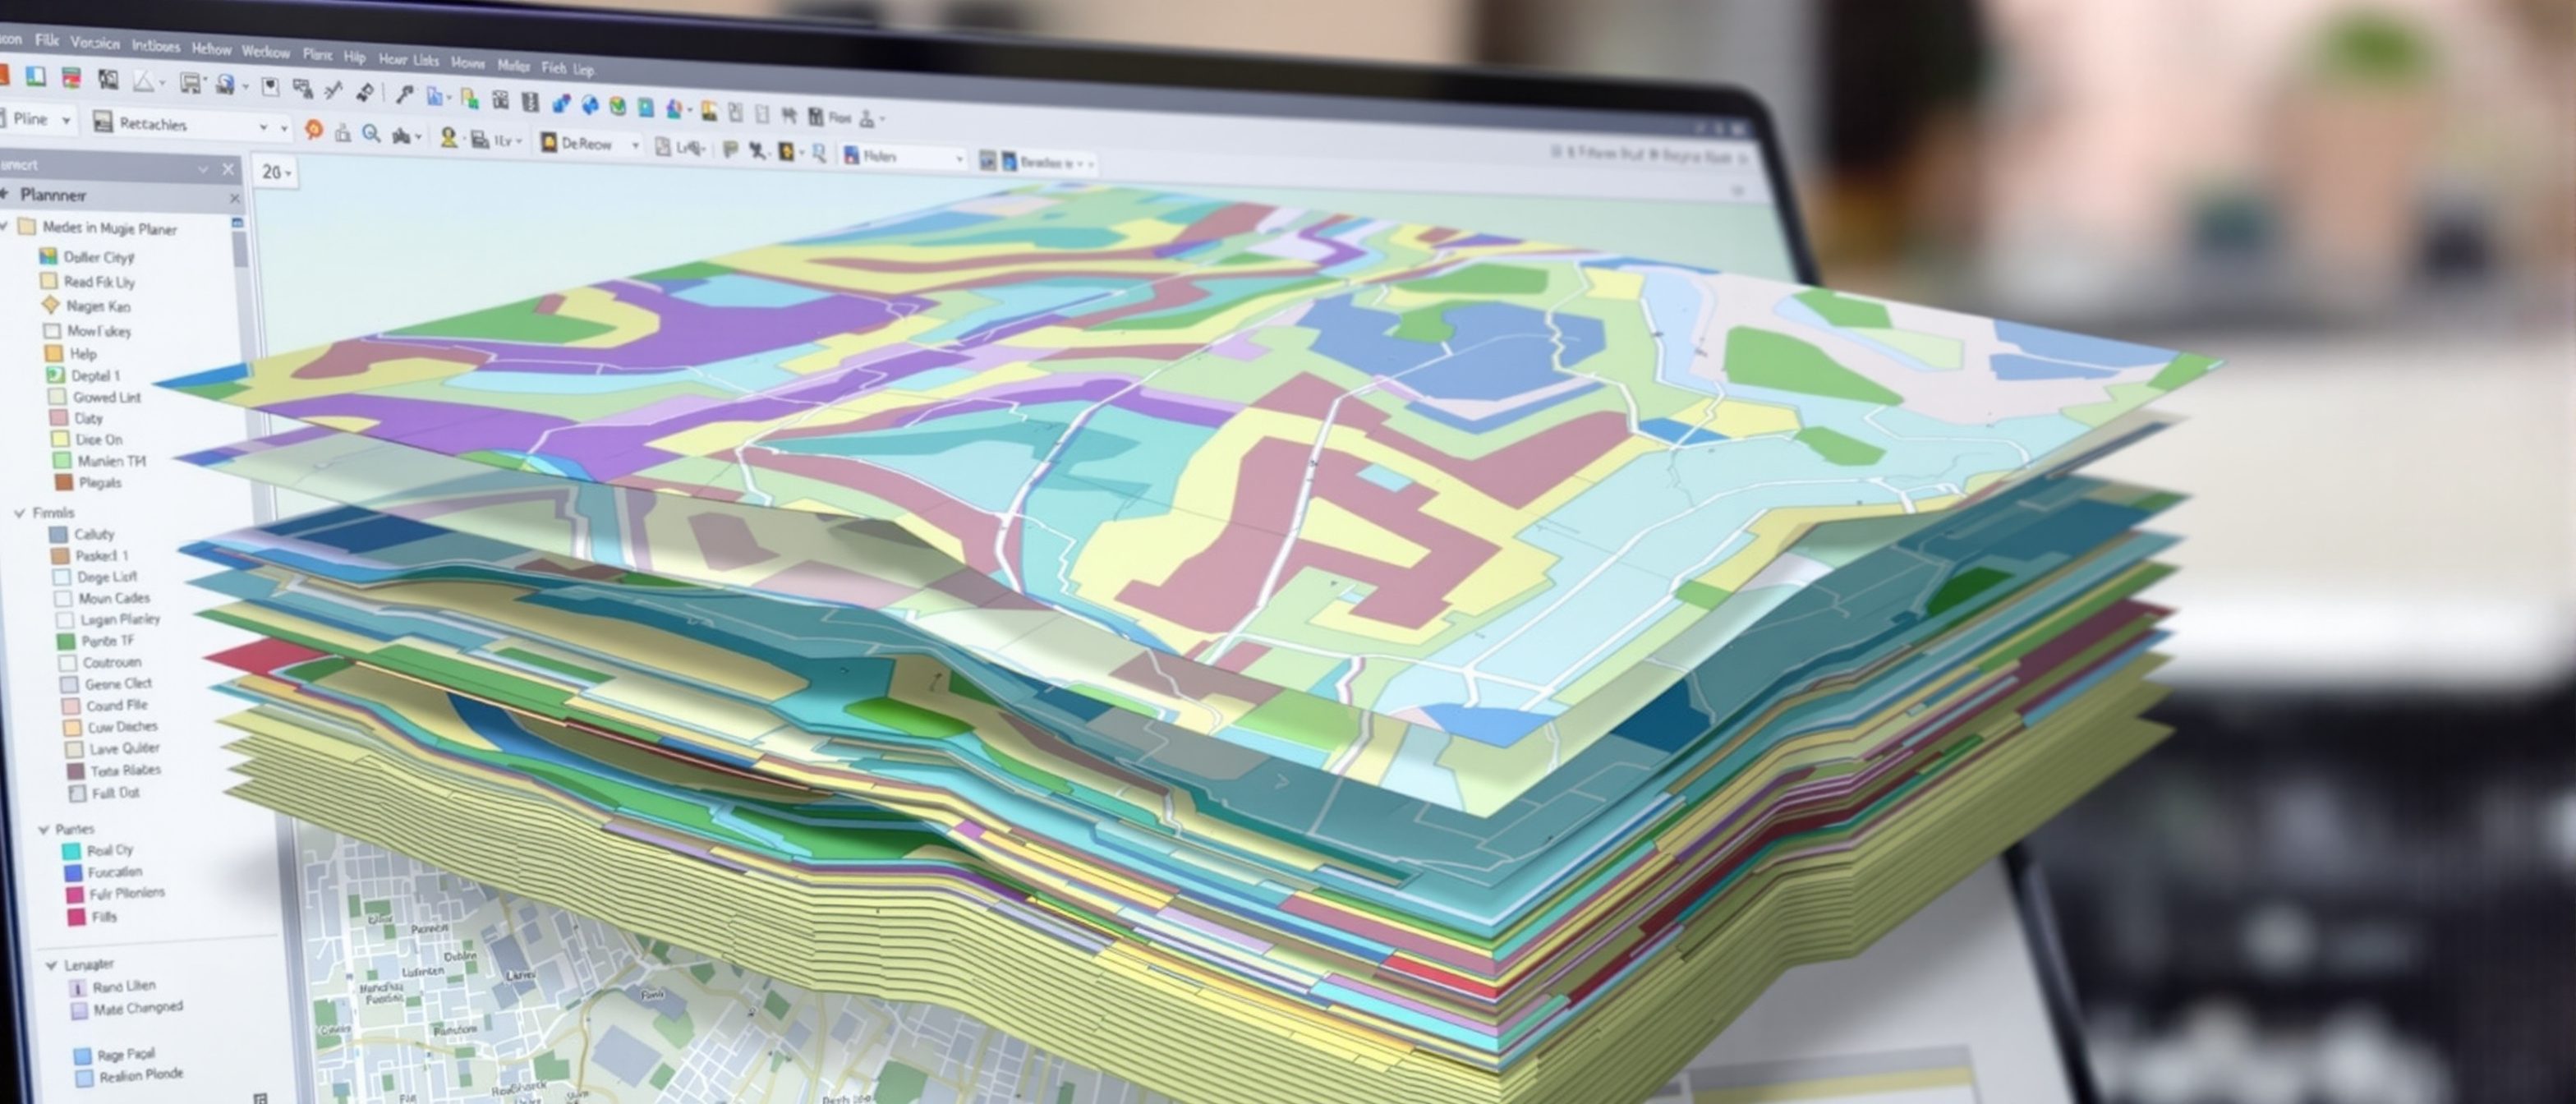
A GIS links place to data and analyses both — holding the world in layers; a map only displays, while a GIS answers combined spatial questions a paper map cannot.[1]
Place + data + analysis
A GEOGRAPHIC INFORMATION SYSTEM (GIS) captures, stores, analyses and displays data tied to LOCATION. Its core idea is that every feature has both a WHERE (geometry — a point, line or area on the earth) and a WHAT (attributes — a table of data about it), and a GIS links the two so you can MAP and ANALYSE them together. The world is held in LAYERS (themes) — roads, plots, land use, contours — that can be stacked and combined. MISCONCEPTION→correct: 'GIS is just a digital map' — a map only DISPLAYS; a GIS ANALYSES — it answers 'which plots within 500 m of a road are zoned residential and above the flood line?', which a paper map cannot.[1]
History, systems & packages
GIS grew from the layered overlay (McHarg, 1969); it is a system of data, people and methods — and capable packages range from commercial ArcGIS to the free, open-source QGIS.[2, 3]
Overlays to software
GIS grew from a simple, powerful idea: the LAYERED OVERLAY. Planners and ecologists (notably Ian McHarg, 'Design with Nature', 1969) stacked transparent map layers on a light table to see where factors coincided; the first computer GIS (Canada GIS, the 1960s) automated exactly this. A modern GIS is a SYSTEM of hardware (computers, storage, digitizers, plotters, GPS), software, DATA (usually the costliest part), and people and methods. MISCONCEPTION→correct: 'GIS is the software' — like BIM, GIS is a system of data, people and methods; the software is one part, and the DATA is usually the largest investment.[2]
At a glance
| Aspect | Detail | Note |
|---|---|---|
| A map | Displays | A picture |
| A GIS | Analyses | Place + data, queryable |
| The world held as | Layers / themes | Stacked and combined |
| Projection | Flattens the sphere | Always distorts something |
| GIS is | Data + people + method | Software is one part; data costs most |
Key terms
A system that links place (geometry) to data (attributes) and analyses both.
One kind of feature (roads, plots, land use) stacked with others.
A GIS analyses and queries; a paper map only displays.
How features are pinned to the earth; flattening a sphere distorts.
Tying a scanned map or image to real-world coordinates.
ArcGIS (commercial), QGIS (free, open-source), spatial databases.
Lab task
Open QGIS (free) and load any two layers of your city (e.g. roads and wards). List three layers a planner would stack to study where new housing could go. Then write one spatial question that a GIS could answer but a paper map could not — and explain why the projection of your layers must match.
Self-assessment
1. The key difference between a GIS and a digital map is that a GIS —
2. You cannot flatten the round earth onto a map without —
3. A capable, free and open-source GIS package is —
Recap
References & further reading
- [1]ESRI, Understanding GIS — what a GIS is, layers, coordinate systems and projections.
- [2]Ian McHarg, Design with Nature (1969) + the history of the layered overlay and early GIS.
- [3]QGIS / ArcGIS documentation — standard GIS packages and automated cartography.
Further reading
- ESRI — Understanding GIS: The ArcGIS Method.
- Maguire, Batty & Goodchild — GIS, Spatial Analysis and Modeling.
- Ian McHarg — Design with Nature.
Sources gathered and fact-checked June 2026. Published values vary by source, sample and method — treat as indicative and confirm against the cited standard before structural use.
The author
Amogh N P
Architect, interior designer, and creative polymath. Studio Matrx began in his notebooks — his vision of design made honest, useful, and open to everyone. Its Academy is written and taught in his memory, and free, forever.
More about Amogh →