
Studio Matrx — Budget Reference
Interior Budget Allocation Map
How ₹5L / ₹10L / ₹20L interior budgets should be distributed across rooms in Indian urban homes — based on typical allocation patterns used by interior design professionals.
Budget Distribution Logic
Interior budgets follow three consistent principles across all tiers:
High-utility spaces first
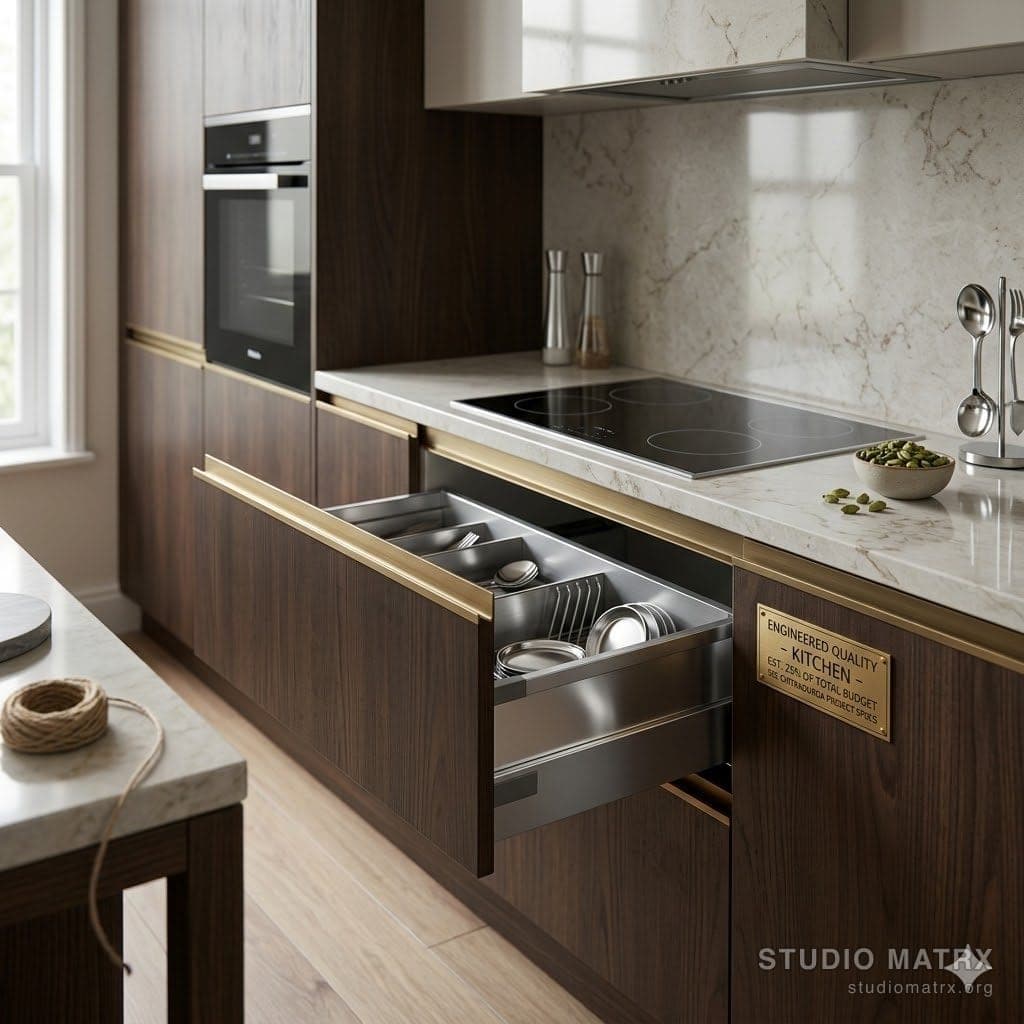
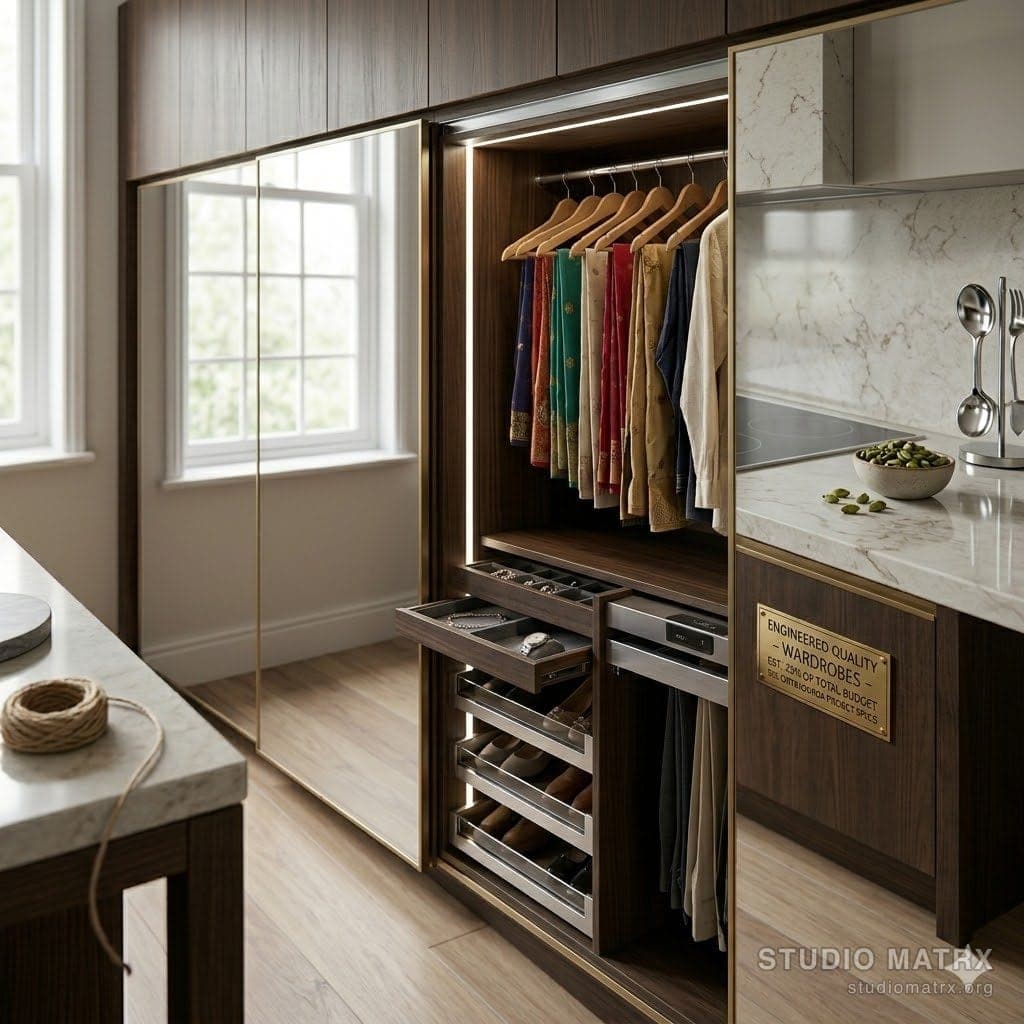
Kitchens and wardrobes absorb the largest share — they have the most complex requirements.
Carpentry dominates
Built-in cabinetry, wardrobes, and storage form the cost backbone at every budget level.
Finishes scale with tier
Higher budgets unlock acrylic, veneer, and concealed lighting — not more rooms.
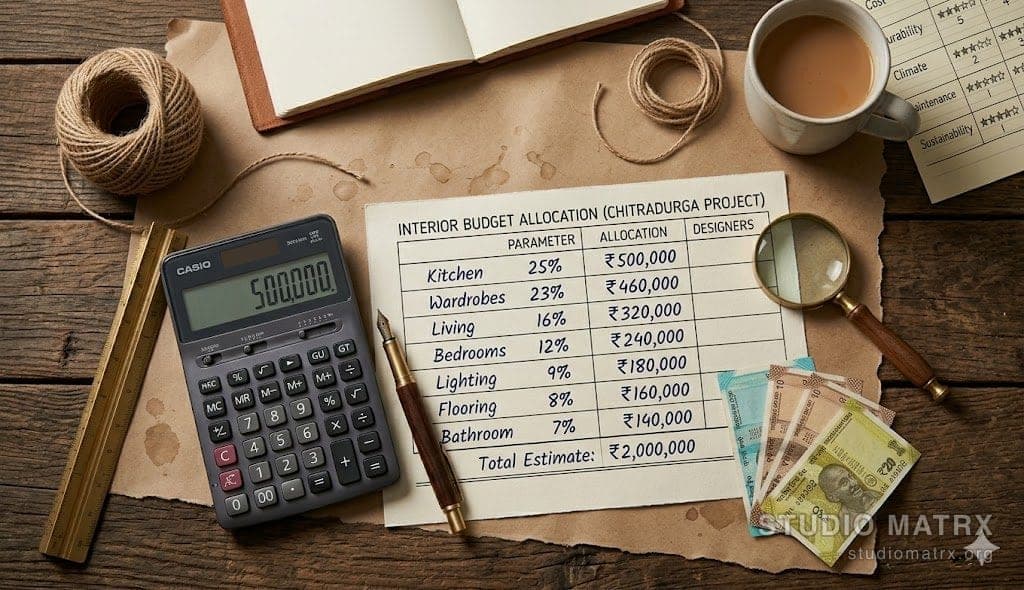
| Area | Typical Share | What drives this |
|---|---|---|
| Kitchen | 20–30% | Highest priority — complex plumbing, electrical, and carpentry |
| Wardrobes | 20–25% | Built-in carpentry dominates; scales with bedroom count |
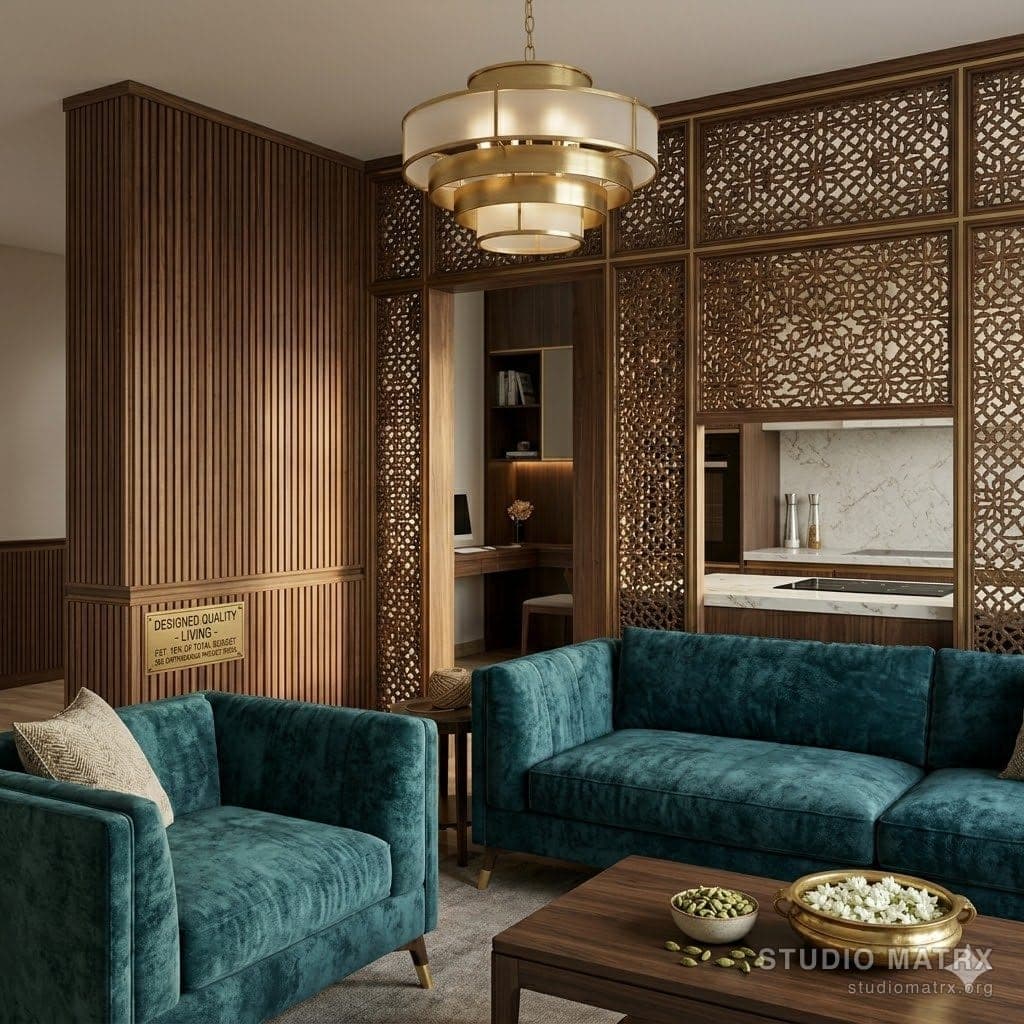
| Living Room | 15–20% | TV unit, wall panels, sofa — visible impact space |
| Bedrooms | 10–15% | Beds, side storage, vanity |
| Lighting & Electrical | 8–10% | Scales up significantly at premium tier |
| Décor & Soft Furnishings | 5–10% | Curtains, cushions, rugs, mirrors |
Budget Scenarios
Essential Functional Setup — compact urban apartments (1–2 BHK) focused on essential carpentry.
Allocation Treemap · ₹5 Lakh
₹5L split across 6 categories
Basic modular cabinets, laminate shutters
1–2 wardrobes
TV unit + small storage
Bed + minimal storage
Basic lighting upgrade
Curtains, mirrors
Design Philosophy
Focus on functional storage and durability, not luxury finishes.
Side-by-Side Summary
Percentage allocation across the three main scenarios.
| Area | ₹5L | ₹10L | ₹20L |
|---|---|---|---|
| Kitchen | 26% | 25% | 22% |
| Wardrobes | 24% | 23% | 21% |
| Living Room | 14% | 16% | 16% |
| Bedrooms | 12% | 12% | 12% |
| Lighting & Electrical | 10% | 9% | 8% |
| Décor / Furnishings | 8% | 8% | 9% |
| Study / Utility | — | 7% | — |
| Dining Area | — | — | 7% |
| Home Office / Bar | — | — | 5% |
What Drives Interior Costs
Across Indian cities, three cost drivers dominate every interior budget.
Carpentry
40–55%
Wardrobes, kitchens, and storage systems. The single largest cost centre in any Indian home interior project.
Materials & Finishes
25–35%
Laminates, veneers, acrylics, paints, and panels. Quality here is what separates mid-range from premium.
Lighting & Décor
10–20%
Lighting fixtures, soft furnishings, and accessories. Often underestimated but disproportionately visible.
Key Insight
Across all three tiers, Kitchen + Wardrobes together account for 43–50% of the total budget. This is the most important number to share with your homeowner upfront — it sets realistic expectations before any other conversation begins.
Source: Typical allocation patterns used by Indian urban interior design providers. Informed by cost structure analysis from Knight Frank, CBRE, and Housing.com residential interior market reports.
Where each rupee goes
Stretch Every Rupee — Render Before You Spend
DesignAI shows you three room concepts at your chosen budget tier, so you know where the money lands before the carpenter starts cutting.
Try DesignAI FreeUse your browser's Print dialog to save as PDF or print directly.
Related Guides — Deep-dive reading
Smart Budget Allocation for Indian Homes
Where every rupee should go — the allocation framework that prevents overspend and regret
Cost & MoneyWhat ₹10 Lakhs Can Actually Build in Interiors
A realistic, itemised look at what a ₹10 lakh interior budget gets you in an Indian home (2026)
Cost & MoneyInterior Cost Breakdown, Room by Room
What each room of an Indian home actually costs to do up — kitchen to balcony
Cost & MoneyRelated Tools — You may also find these useful
Interior Budget Planner
Live room-wise and component-wise cost breakdown in ₹ with contingency, GST, and PDF summary.
Budget CalculatorBefore vs After — Cost Reality Check
Compare what you expected to pay vs what you actually paid, category by category.
Reality CheckLandscape Cost Calculator
Estimate a garden's cost — hardscape, softscape, lawn, irrigation, lighting and annual upkeep — by area, tier and city.
Budget Calculator