
Total Station, GIS, LIDAR & Photogrammetry
The modern toolkit — from one instrument to the 3-D point cloud.
In a generation, surveying went from chain and theodolite to a digital toolkit. One instrument now reads angles, distances and coordinates; satellites fix position; lasers and cameras scan whole landscapes into 3-D. The architect rarely operates these — but must know what each produces and how it flows into CAD, BIM and GIS.
Learning objectives
By the end of this lesson, you will be able to — mapped to the course outcomes for Surveying, Levelling & Site Planning:
Explain how a total station measures angles, distances and coordinates.
Distinguish GIS (analysis) from GPS, LIDAR and photogrammetry (data capture).
Describe how LIDAR and photogrammetry produce point clouds and terrain models.
Outline the field-to-finish workflow into CAD, BIM and GIS.
The modern toolkit
The total station merges an electronic theodolite, distance measurement and a computer; GPS positions by satellite; GIS analyses spatial data in layers; LIDAR and photogrammetry capture dense 3-D data from lasers and overlapping photos.[1, 3]
Electronic theodolite + EDM
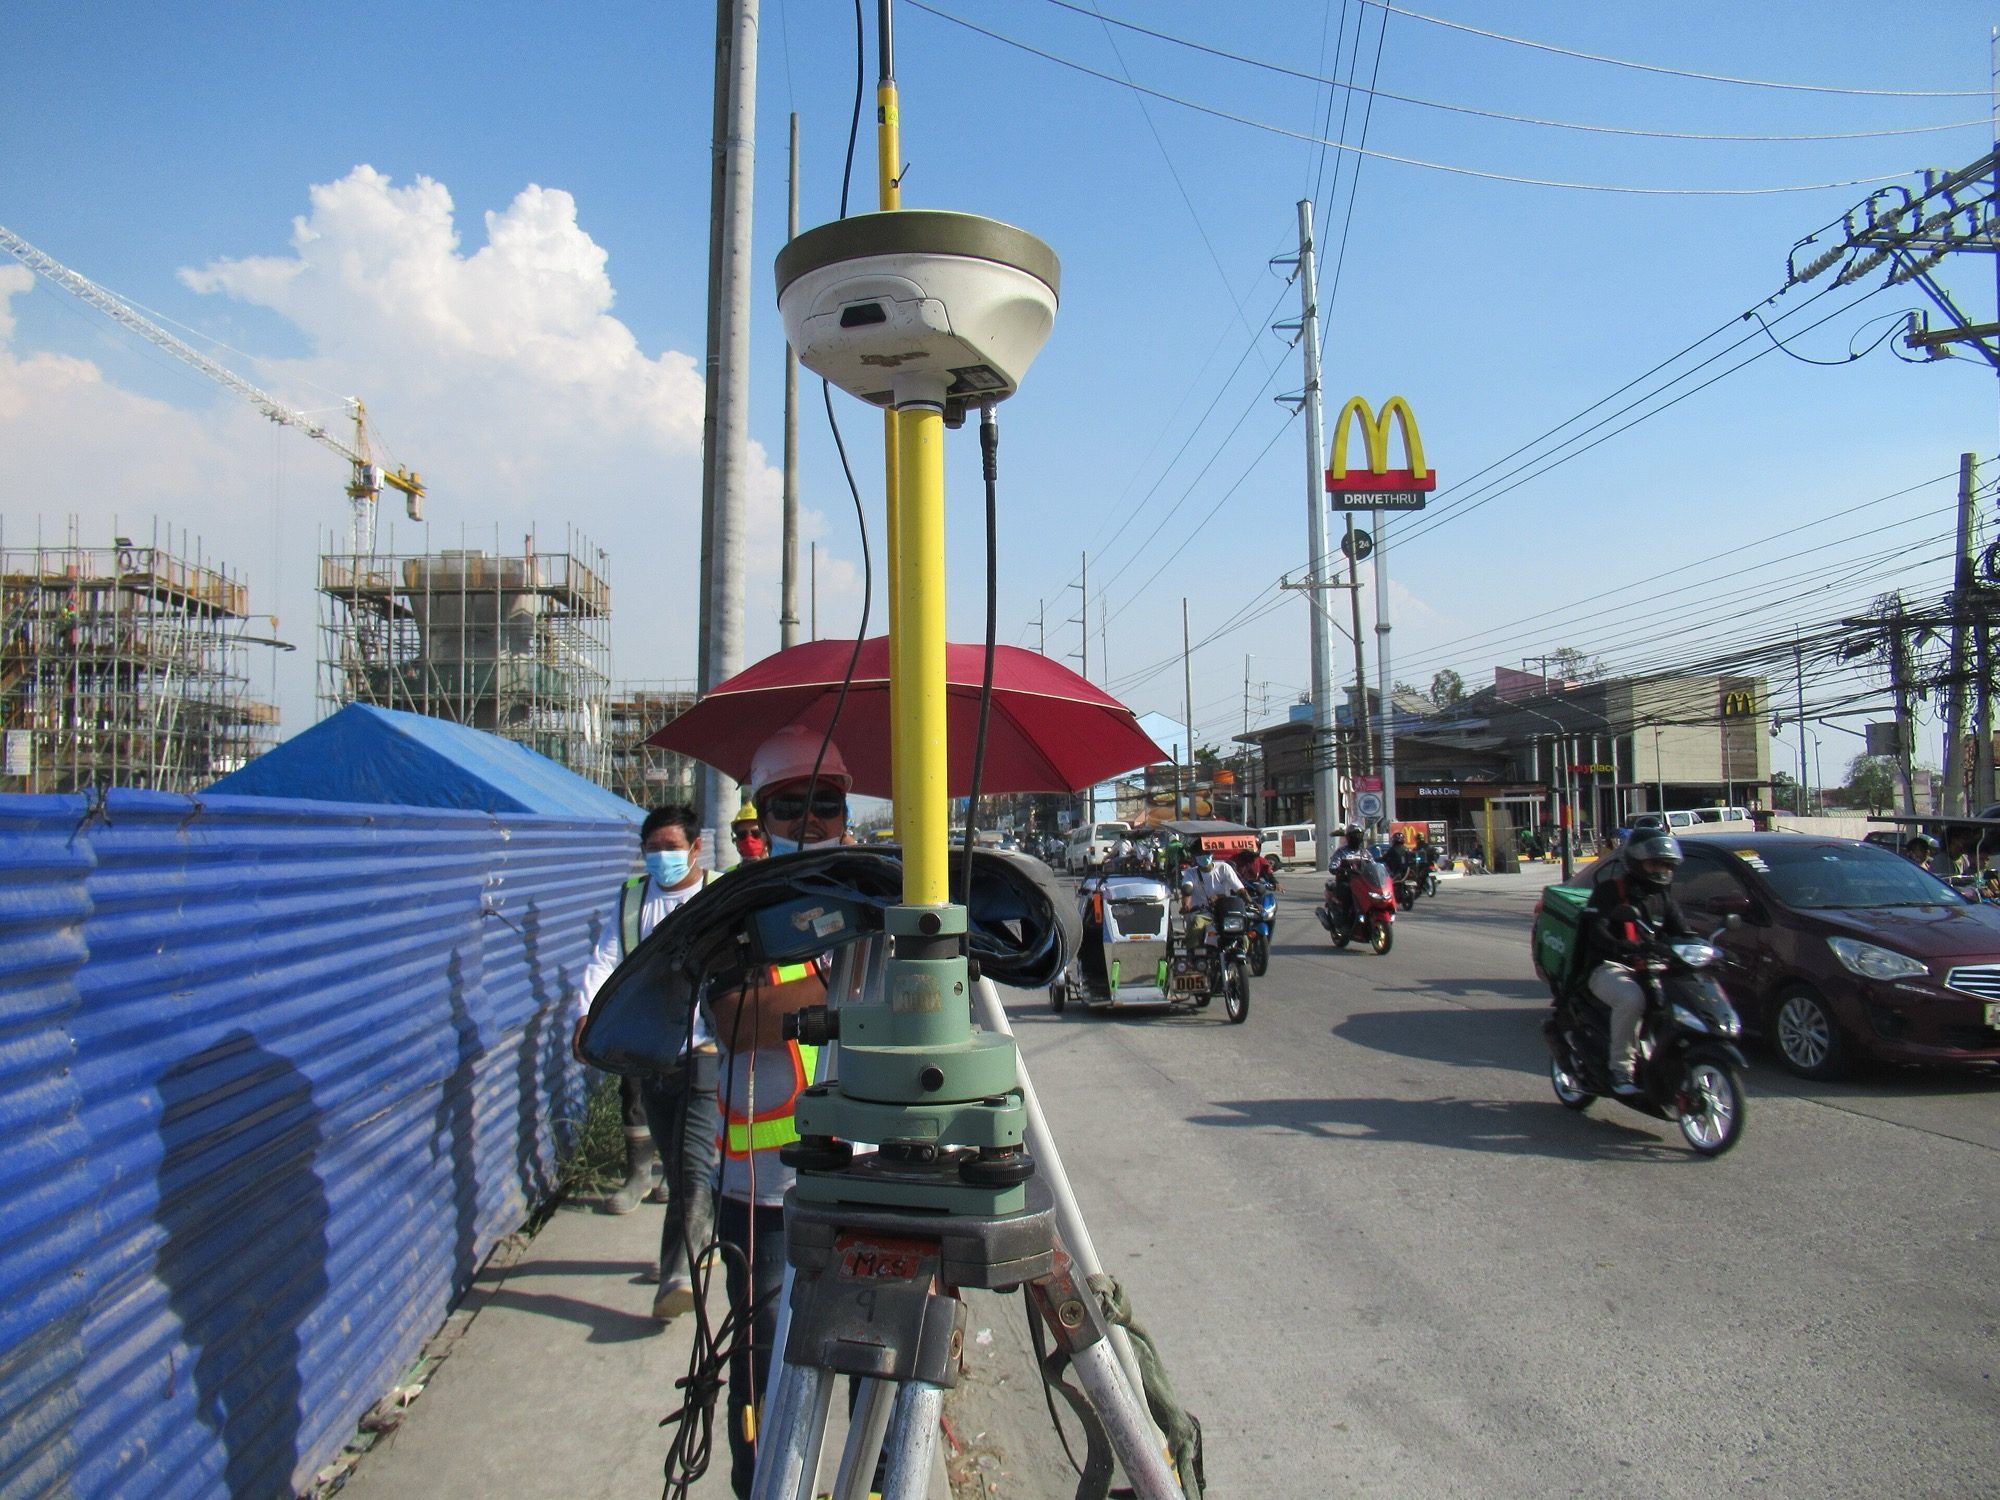
A total station unites an electronic theodolite, electronic distance measurement (a beam timed to a prism), and an onboard computer. In one set-up it reads angles and distances and computes 3-D coordinates, logged digitally — replacing the separate theodolite and chain.[1, 2]
Old vs new, LIDAR vs photogrammetry
| Aspect | One | The other |
|---|---|---|
| Distance | Total station: EDM (electronic) | Chain + theodolite: tape (manual) |
| Sensor | LIDAR: active laser pulses | Photogrammetry: passive photos |
| Primary product | LIDAR: 3-D point cloud direct | Photogrammetry: imagery → 3-D + orthophoto |
| Role | GIS: analysis / database | GPS / LIDAR: data capture |
| Output | Modern: digital 3-D, instant | Traditional: manual reduction |
Key terms
An electronic theodolite + EDM + computer that outputs 3-D coordinates.
Electronic Distance Measurement — distance by timing a reflected beam.
Satellite positioning; DGPS/RTK give centimetre survey accuracy.
A system to store, analyse and display layered spatial data (not a field instrument).
Light Detection and Ranging — laser pulses timed to build a 3-D point cloud.
A dense set of x, y, z points from LIDAR or photogrammetry.
Deriving measurements and 3-D models from overlapping photographs.
A geometrically corrected image; a Digital Elevation Model of the bare-earth surface.
Study task
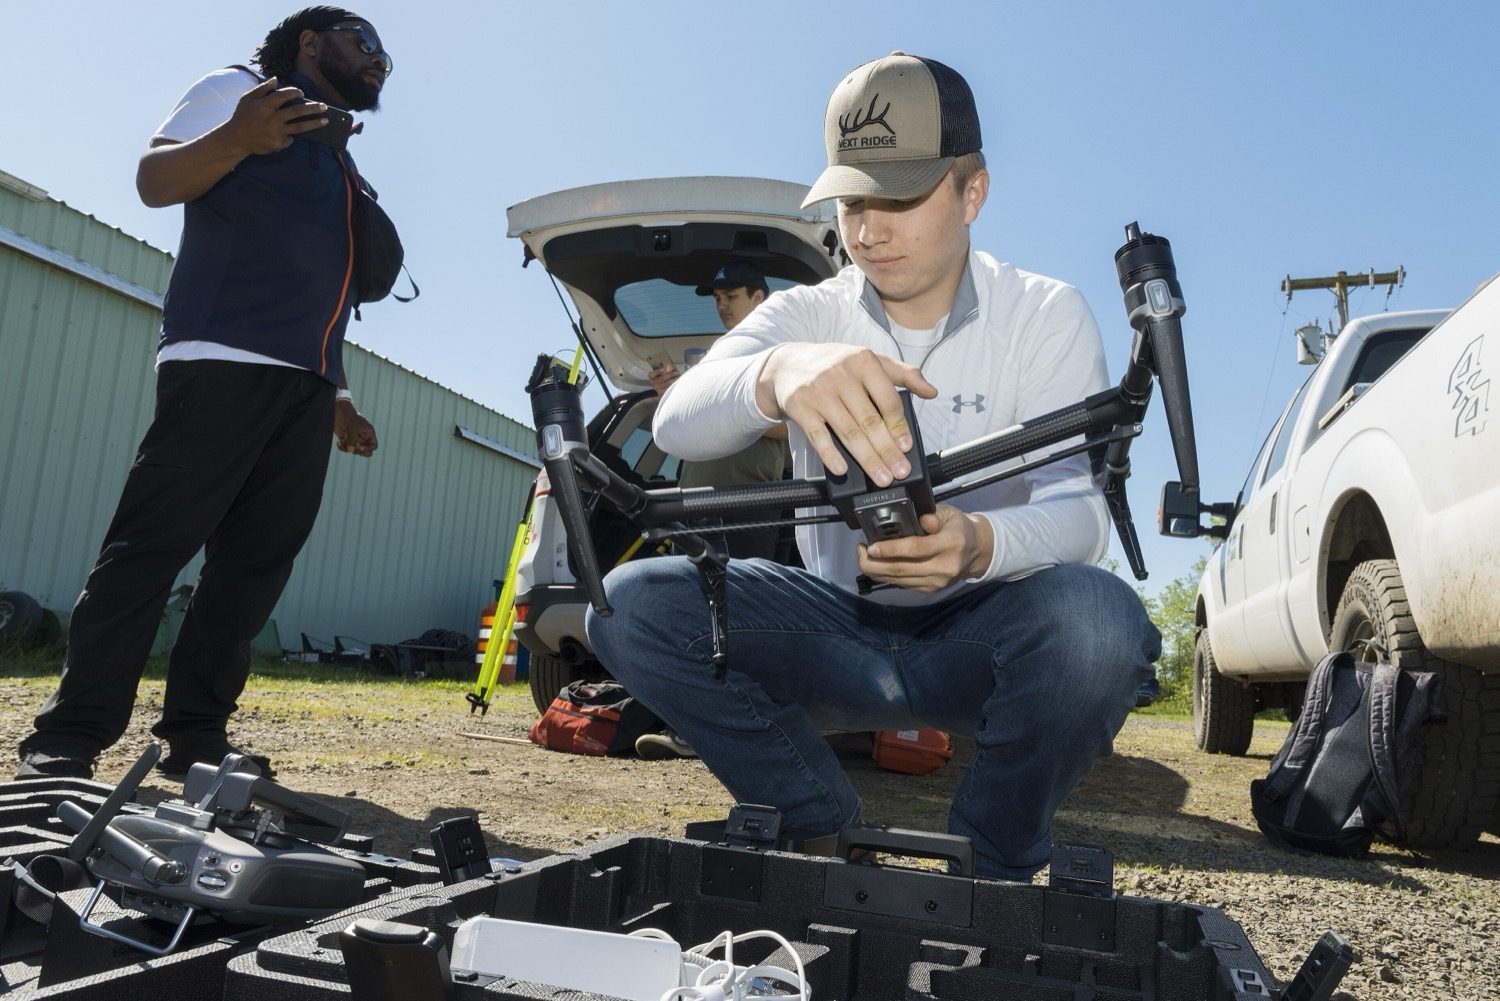
In a short paragraph, trace a site survey from field to design: which tool captures the ground (total station / drone / LIDAR), what it produces (coordinates, orthophoto, point cloud, DEM), and how that feeds CAD, BIM and GIS. Note which of these is an analysis system rather than a measuring instrument.
Self-assessment
1. A total station essentially combines a theodolite with —
2. A dense 3-D point cloud built by timing reflected laser pulses comes from —
3. Which is an analysis and database system rather than a field instrument?
Recap
References & further reading
- [1]S.K. Duggal, Surveying Vol. II (electronic surveying / total station). McGraw-Hill Education.
- [2]B.C. Punmia, A.K. Jain & A.K. Jain, Surveying Vol. II. Laxmi Publications.
- [3]U.S. Geological Survey (USGS) — LIDAR data and Digital Elevation Models. https://www.usgs.gov/faqs/what-lidar-data-and-where-can-i-download-it
- [4]ASPRS — Manual of Photogrammetry; Esri — GIS and ortho-mapping documentation.
Further reading
- S.K. Duggal, Surveying Vol. II.
- B.C. Punmia, Surveying Vol. II.
- ASPRS, Manual of Photogrammetry (6th ed.).
Sources gathered and fact-checked June 2026. Published values vary by source, sample and method — treat as indicative and confirm against the cited standard before structural use.
The author
Amogh N P
Architect, interior designer, and creative polymath. Studio Matrx began in his notebooks — his vision of design made honest, useful, and open to everyone. Its Academy is written and taught in his memory, and free, forever.
More about Amogh →