
Contouring
Reading the shape of the land from lines of equal height.
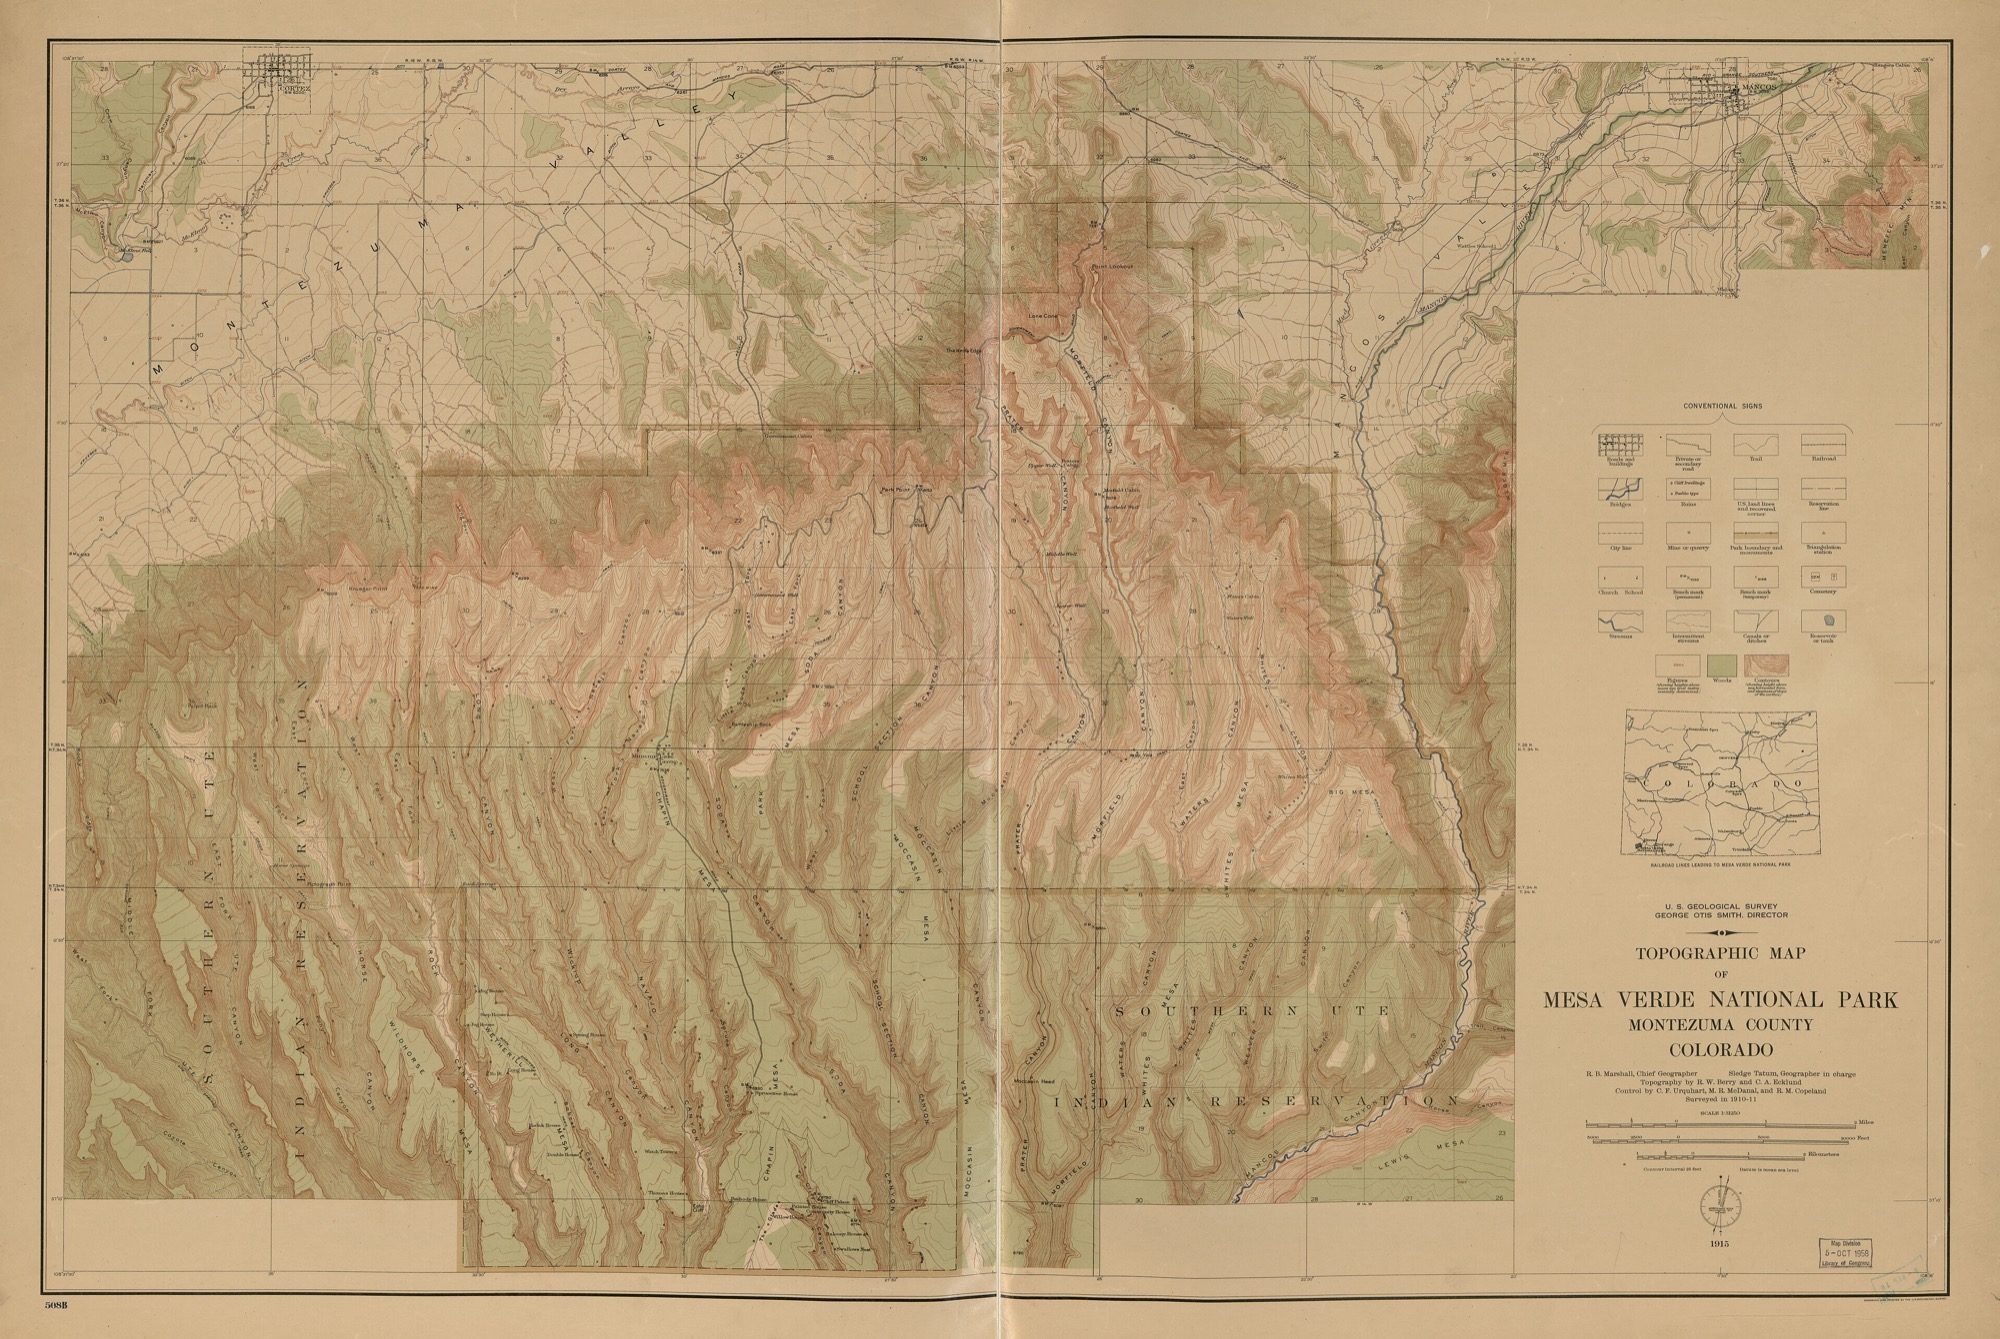
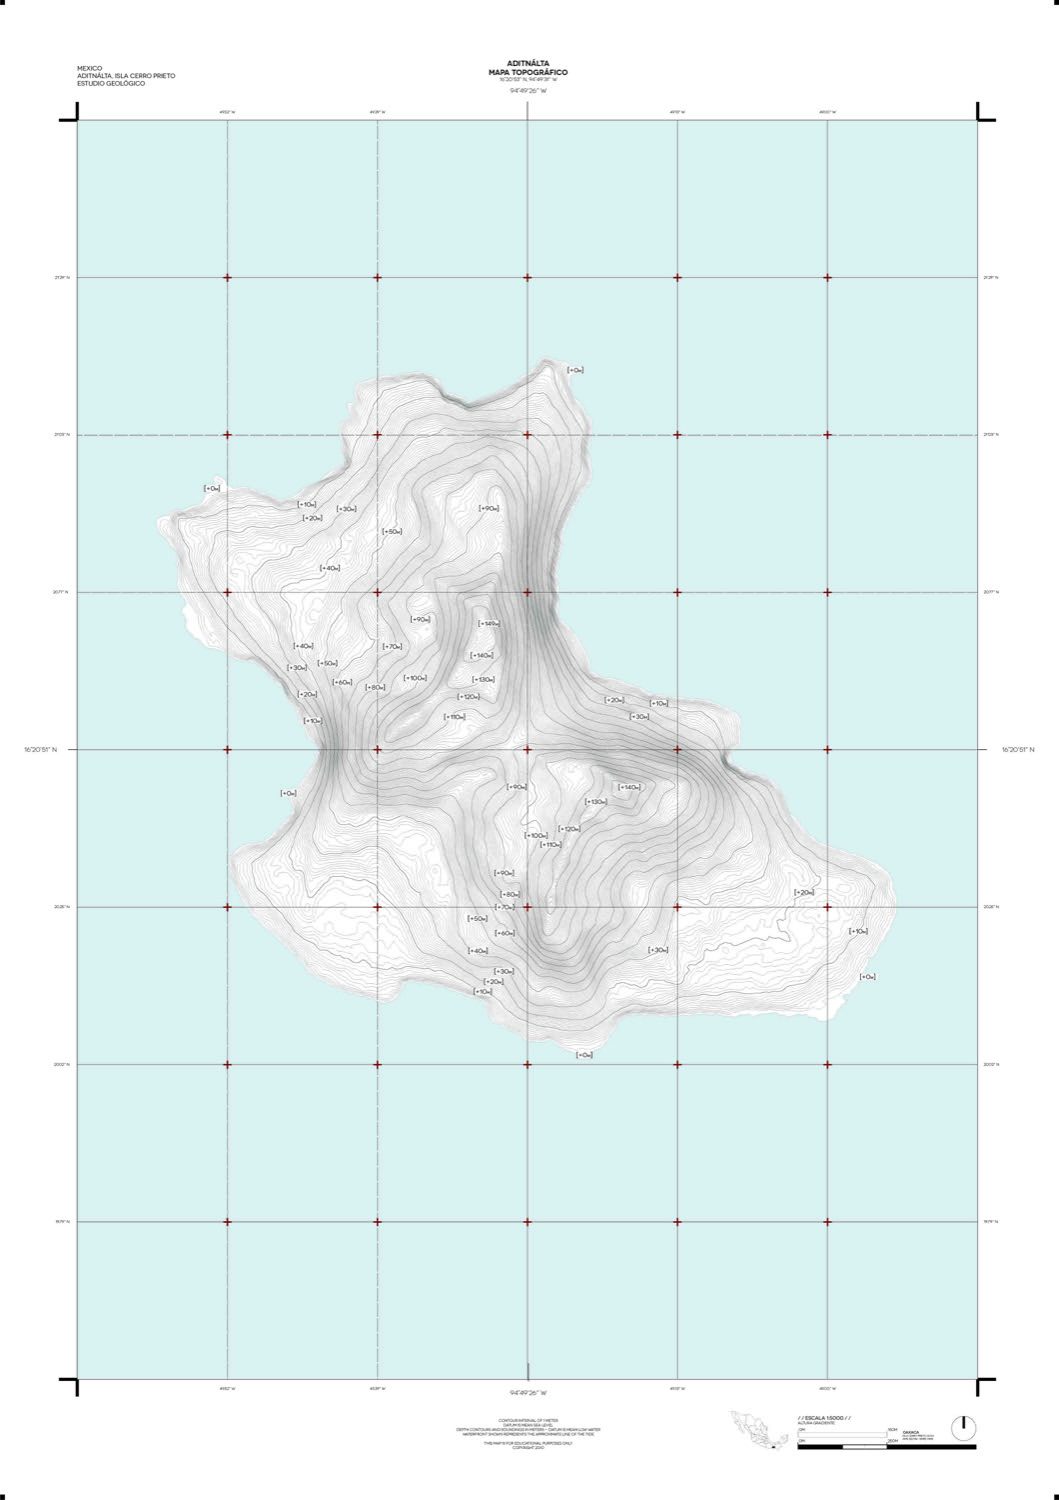
A contour map is the architect's X-ray of the land. Each contour joins points of equal height, so the pattern of the lines tells you, at a glance, where the ground is steep or gentle, where the hills, valleys and drainage lines run, and where it is sensible to build. Learn to read them — and to turn their spacing into a gradient.
Learning objectives
By the end of this lesson, you will be able to — mapped to the course outcomes for Surveying, Levelling & Site Planning:
Define a contour, the contour interval and the horizontal equivalent.
Read the characteristics of contours to identify hills, valleys and slope.
Distinguish the direct and indirect methods of contouring.
Compute the gradient between two contours as 1 in N and a percentage.
Reading contours
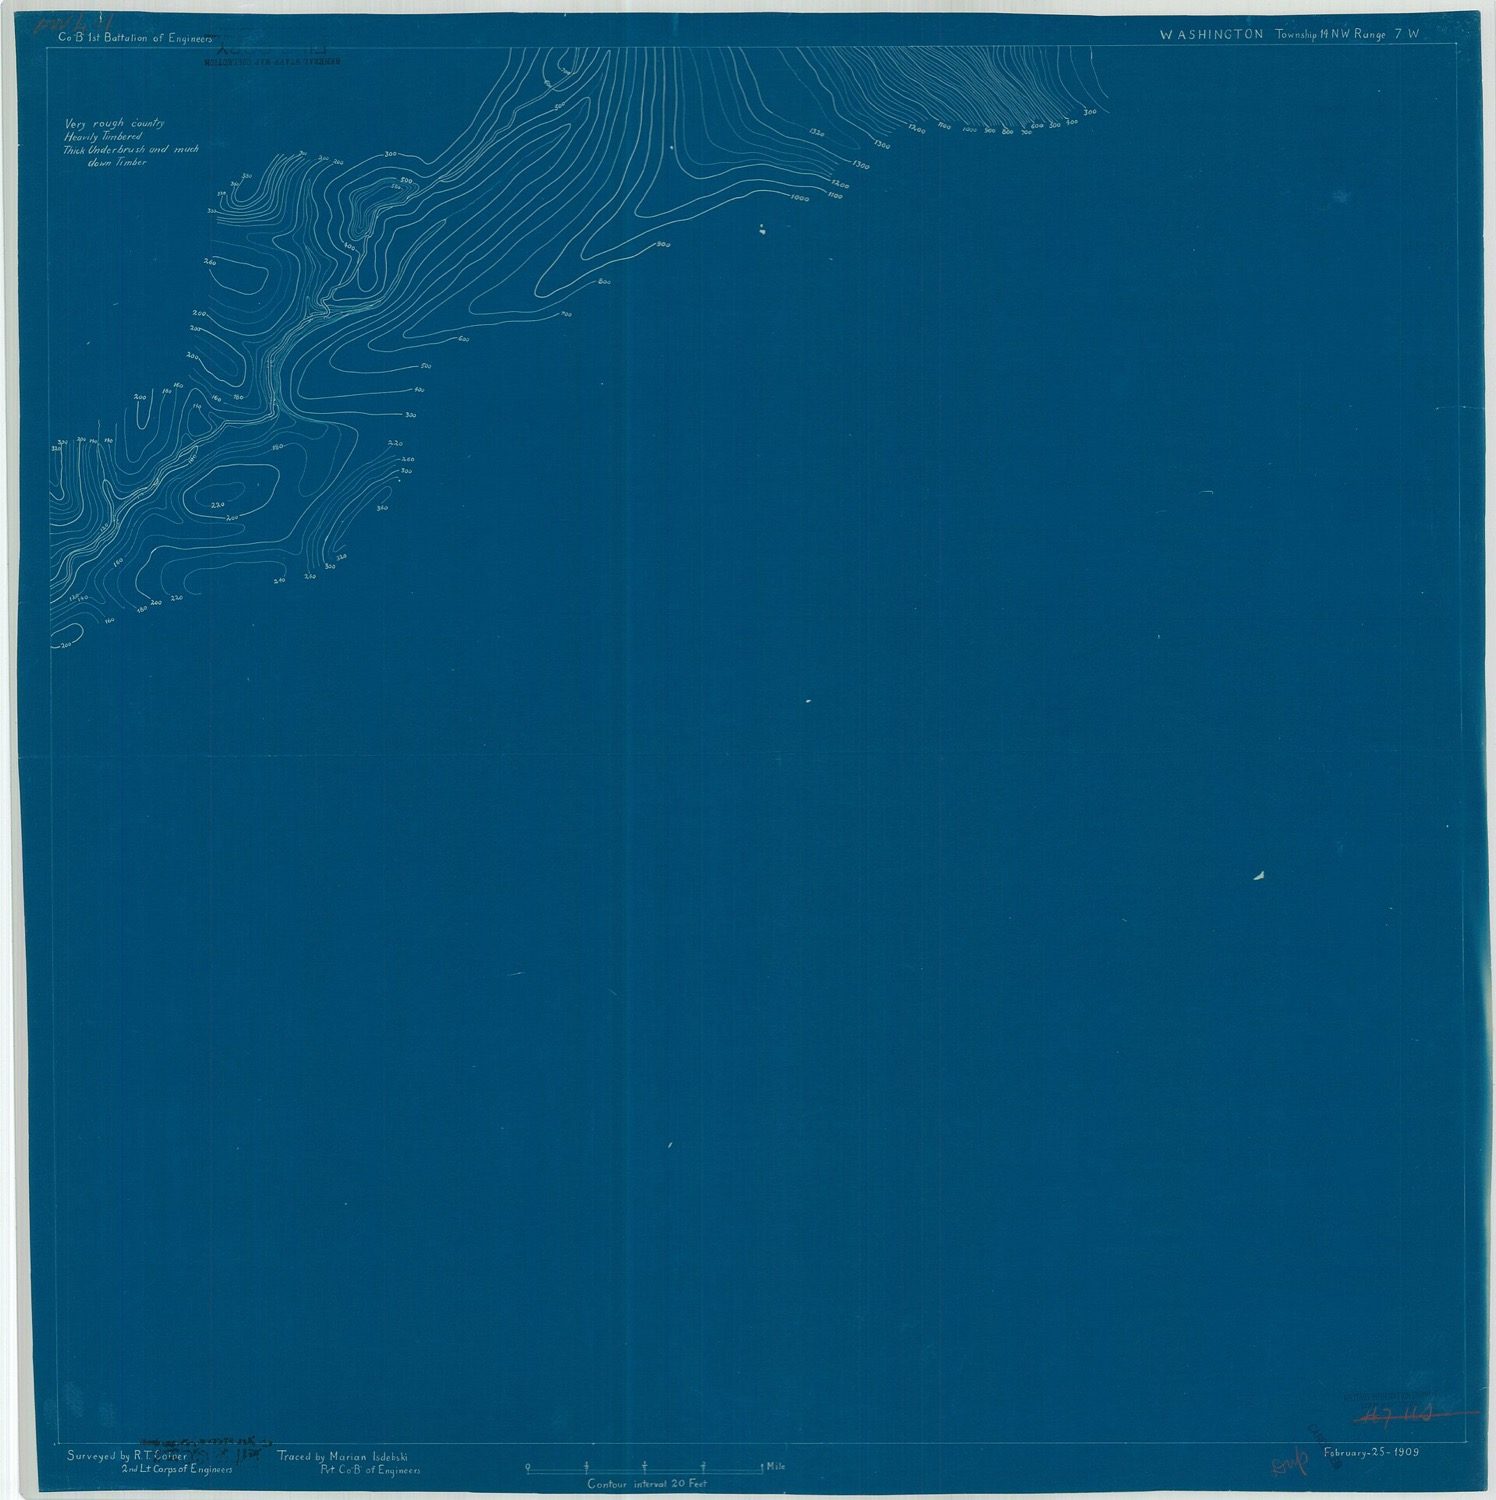
With the contour interval held constant, the spacing of the lines reads as slope; their pattern reveals hills, valleys and ridges. Close together is steep, far apart gentle; across a valley the V points uphill.[1, 2]
Methods and gradient
Contours are plotted directly (tracing real points) or, usually, indirectly (grid spot levels then interpolation). The spacing converts to a gradient — 1 in N, or a percentage.[1]
Find the gradient
A 5 m fall over 100 m is a gradient of 1 in 20, or 5% — a gentle, buildable slope. Change the levels and distance and watch the gradient and its site-planning verdict.
Contour gradient · slope between two points
Gradient 1 in N = distance ÷ rise; slope% = rise ÷ distance × 100.
1 in 20.0
Gradient
0.0 %
Slope
0.0 m
Height difference
0.0°
Slope angle
Bands vary by reference; a 5 m fall over 100 m = 1 in 20 = 5%.
Contour quick reference
| Aspect | One | The other |
|---|---|---|
| Contour spacing | Close: steep slope | Far apart: gentle slope |
| Obtained by | Direct: tracing real points | Indirect: interpolating spot levels |
| Accuracy / speed | Direct: accurate, slow | Indirect: faster, usual method |
| Valley vs ridge V | Valley: V points uphill | Ridge: V points downhill |
| Gradient form | 1 in N (horizontal ÷ vertical) | Percent (vertical ÷ horizontal × 100) |
Key terms
A line joining points of equal elevation (reduced level).
The constant vertical distance between successive contours.
The horizontal distance between contours — varies with slope.
Rise over horizontal distance, as 1 in N or a percentage.
The reduced level of a single surveyed point used for interpolation.
Estimating where whole-number contours fall between spot levels.
Tracing contour points of a target RL on the ground — accurate, slow.
Taking grid spot levels then interpolating contours — fast, usual.
Worked example
Two points read 105 m and 100 m, 100 m apart: the fall is 5 m, so the gradient is N = 100 ÷ 5 = 1 in 20, and the slope is 5 ÷ 100 × 100 = 5% — gentle, ideal for building. Confirm in the calculator, then test a steeper case.
Self-assessment
1. Contours drawn very close together indicate —
2. Where a contour crosses a valley, the V points —
3. A 5 m fall over a horizontal distance of 100 m is a gradient of —
Recap
References & further reading
- [1]B.C. Punmia, A.K. Jain & A.K. Jain, Surveying Vol. I. Laxmi Publications.
- [2]S.K. Duggal, Surveying Vol. I. McGraw-Hill Education.
- [3]T.P. Kanetkar & S.V. Kulkarni, Surveying and Levelling. PVG Prakashan.
Further reading
- B.C. Punmia, Surveying Vol. I.
- S.K. Duggal, Surveying.
- N.N. Basak, Surveying and Levelling. McGraw-Hill.
Sources gathered and fact-checked June 2026. Published values vary by source, sample and method — treat as indicative and confirm against the cited standard before structural use.
The author
Amogh N P
Architect, interior designer, and creative polymath. Studio Matrx began in his notebooks — his vision of design made honest, useful, and open to everyone. Its Academy is written and taught in his memory, and free, forever.
More about Amogh →