
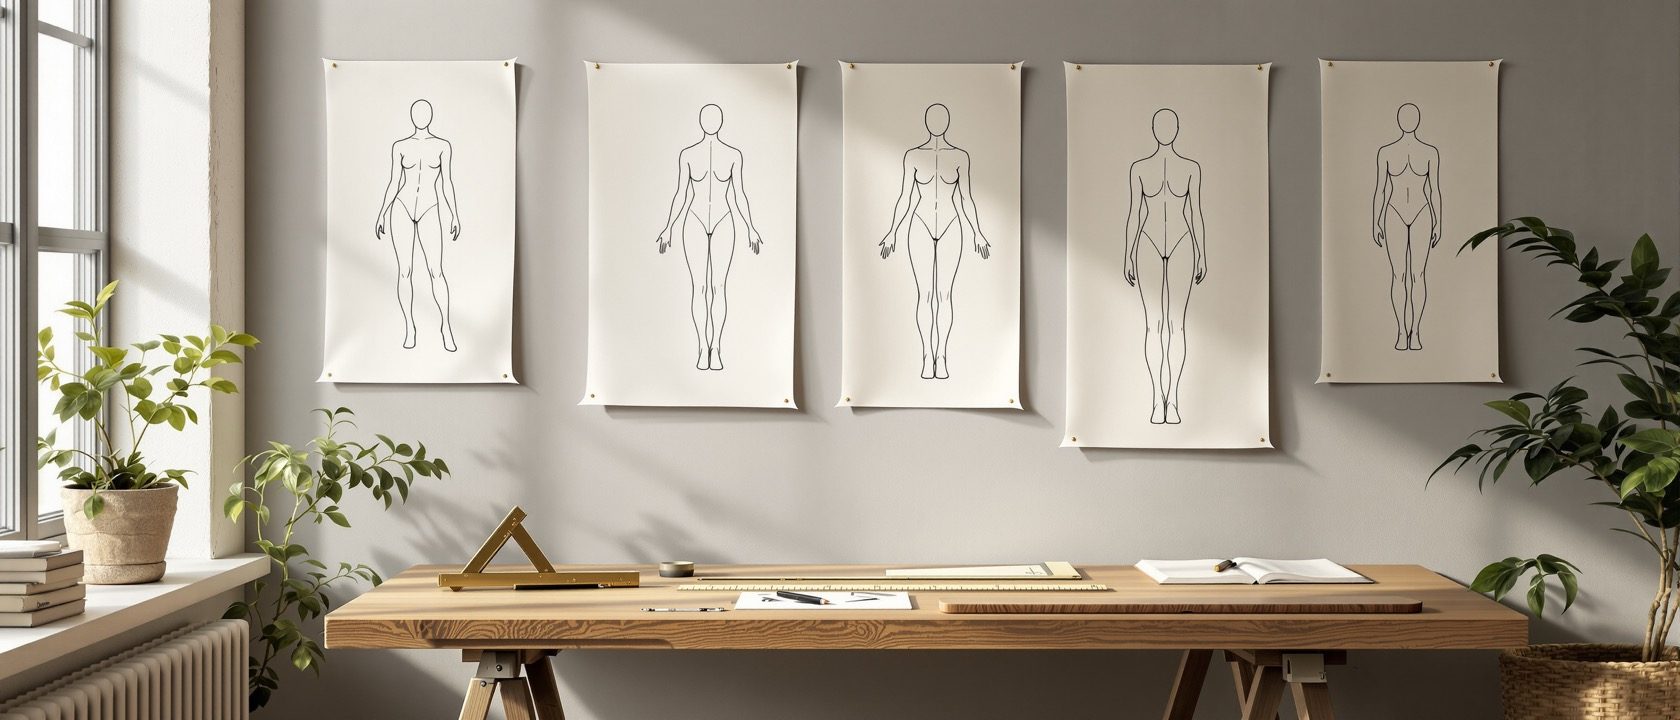
The Human Measure
Anthropometry, percentiles, and why the average person doesn't exist
Space planning begins with the body. This unit opens with the correction that reframes the whole subject: you do not design for ‘the average person’, because the average person does not exist — in 1952 the US Air Force found that of 4,063 pilots, not one was average on all ten body dimensions. From there it lays out anthropometry, the percentile logic a designer lives by, the difference between the still body and the body in motion, and the most important correction for a course taught in India: Western data is not Indian data.
Learning objectives
By the end of this lesson, you will be able to — mapped to the course outcomes for Space Planning & Ergonomics:
Explain the 'average man' fallacy using the Daniels 1952 study, and why the average person does not exist.
Choose the right percentile for a design decision — clear for the tall, reach for the small, adjust for all.
Distinguish anthropometry from ergonomics, and structural (static) from functional (dynamic) dimensions.
Explain why Western anthropometric tables mis-size Indian interiors, and cite the correct Indian data source.
The average-man fallacy
Cockpits sized to ‘the average man’ fitted almost nobody — and the fix was not a better average but adjustability, which is why every car seat now slides. The rule that follows: clear for the tall, reach for the small, adjust for all.[1, 2]
Of 4,063 pilots, not one was average
In 1952 the US Air Force anthropologist Gilbert S. Daniels measured 4,063 pilots on ten body dimensions and asked how many were 'average' (in the middle band) on all ten at once. The answer was NONE — not a single pilot — and fewer than 3.5% were average on even three dimensions. Cockpits sized in the 1920s to 'the average man' therefore fitted almost nobody, which was killing pilots in non-combat accidents.[1]
Measuring the body
Anthropometry measures the body; ergonomics applies it. Learn the difference between the still body and the body in motion, and which measurement governs which fixture — and half of space planning is done.[2, 3]
Anthropometry is not ergonomics
Anthropometry is the MEASUREMENT of the human body — a dataset of dimensions like stature, elbow height and reach. Ergonomics is the DESIGN discipline that applies those measurements (plus biomechanics, physiology and cognition) to fit tasks and spaces to people. Anthropometry supplies the numbers; ergonomics decides what to do with them. Saying 'I did the ergonomics' because you consulted a dimensions table is like saying you did the architecture because you owned a tape measure.[3]
Who does this fit?
Test a shelf, a switch, a doorway and a fixed counter against three users — small, mid and large — and watch the governing rule appear. The fixed counter is the one nobody fits, which is exactly why worktops should be adjustable.
Percentile fit · design for the range, not the average
Illustrative Indian bands · a real spec uses Chakrabarti 1997
A high wall shelf
2/3 servedGoverned by: the SMALL user
A shelf you must reach into is a REACH problem, so it is governed by the person with the shortest reach. Set to a height the 5th-percentile user can reach, and everyone taller reaches it too. Size it to the tall user and you lock the short user out.
Clear for the tall, reach for the small, adjust for all — the fixed counter is the one nobody fits, which is exactly why worktops should be adjustable or user-fitted.
Indian bodies, Indian data
The famous data sources — Dreyfuss, Panero & Zelnik — are US data, and Indian adults are on average about 11 cm shorter (and recently declining). Use Chakrabarti’s 1997 NID dataset for Indian users, not an imported table.[4, 5, 6]
An 11 cm gap you cannot ignore
The most famous interior-design data sources — Henry Dreyfuss's 'The Measure of Man' and Panero & Zelnik's 'Human Dimension & Interior Space' (1979) — are US-population data. But Indian adults are, on average, shorter and differently proportioned: the mean Indian adult male stature is about 164–165 cm against roughly 175 cm in the US — an ~11 cm gap that cascades through counter height, reach and seating. Applying an American 95th-percentile clearance or a 50th-percentile worktop to Indian users systematically mis-sizes the room.[4, 5]
At a glance
| Aspect | The fact | The folklore |
|---|---|---|
| Who to design for | A range of users (percentiles), with adjustability where one size can't fit | 'The average person' |
| Clearances (doors, legroom) | Sized to the LARGE (95th-percentile) user | Sized to the average user |
| Reaches & controls (shelves, switches) | Sized to the SMALL (5th-percentile) user | Sized to the average user |
| Anthropometry vs ergonomics | Measuring the body vs the design discipline that applies it | The same thing |
| Data for Indian users | Chakrabarti 1997 (NID) / Indian datasets, cited by year | Dreyfuss / Panero & Zelnik US tables, as-is |
| Anthropometric data | Ages and varies by region — cite year and population | Fixed and timeless |
Key terms
The measurement of the human body — the dataset of dimensions (stature, reach, elbow height) that ergonomics applies to design.
The rank of one body dimension in a population: a 5th-percentile reach means 95% of people reach further; a 95th-percentile stature means 95% are shorter.
Body dimensions measured while still, in fixed standard postures (ISO 7250) — e.g. standing height, seated eye height.
Body dimensions measured while moving or performing a task — e.g. maximum forward reach; usually more relevant to how interiors are actually used.
Floor to the crease behind the knee when seated — the dimension that sets a chair's seat height (feet flat, no thigh compression).
The design answer when one fixed dimension cannot satisfy both a small and a large user — the Air Force's real fix, and why car seats slide.
Study task
Pick one everyday element — a kitchen counter, a wardrobe rail, a light switch, a study desk — and analyse it for three users: a small (5th-percentile) adult, a mid-size adult, and a large (95th-percentile) adult. State which body dimension governs it (a reach or a clearance), decide which percentile should therefore drive its height or size, and say whether one fixed value can serve all three or whether it must be adjustable. Then note whether you used Western or Indian data, and why that matters. Learning to ask ‘which user, which dimension, code or adjustable?’ for every element is the whole habit this course is building.
Self-assessment
1. What did Gilbert Daniels' 1952 study of 4,063 US Air Force pilots find?
2. You are placing a light switch. Which user governs the height?
3. What is the difference between anthropometry and ergonomics?
4. Why is it wrong to use Panero & Zelnik's US data for an Indian kitchen?
5. What is the honest status of anthropometric data over time?
Recap
References & further reading
- [1]Daniels, G. S., 'The Average Man?' (Wright Air Development Center, USAF, 1952; DTIC accession AD0010203). Retold in Todd Rose, 'The End of Average' (HarperOne, 2016). https://apps.dtic.mil/sti/citations/AD0010203
- [2]Cornell University Ergonomics (Prof. Alan Hedge) — anthropometry and workspace-design course notes; RoyMech anthropometric percentile tables.
- [3]ISO 7250: Basic human body measurements for technological design — definitions of structural body dimensions. https://www.iso.org/standard/66334.html
- [4]Panero, J. & Zelnik, M., 'Human Dimension & Interior Space' (Whitney Library of Design, 1979) — US-population interior anthropometry. https://www.google.com/books/edition/Human_Dimension_and_Interior_Space/YyQEmZmYh0IC
- [5]Bhardwaj, S. et al., analysis of National Family Health Survey adult-height trends (India), PLOS/PMC (PMC8448320) — the ~1.1 cm decline in young men's mean height, 2005–06 to 2015–16. https://www.ncbi.nlm.nih.gov/pmc/articles/PMC8448320/
- [6]Chakrabarti, Debkumar, 'Indian Anthropometric Dimensions for Ergonomic Design Practice' (National Institute of Design, Ahmedabad, 1997; ISBN 81-86199-15-0).
Further reading
- Todd Rose, The End of Average (HarperOne, 2016) — the Daniels study retold in full.
- Julius Panero & Martin Zelnik, Human Dimension & Interior Space (Whitney/Watson-Guptill, 1979).
- Stephen Pheasant & Christine Haslegrave, Bodyspace: Anthropometry, Ergonomics and the Design of Work, 3rd ed. (Taylor & Francis, 2006).
Sources gathered and fact-checked June 2026. Published values vary by source, sample and method — treat as indicative and confirm against the cited standard before structural use.
The author
Amogh N P
Architect, interior designer, and creative polymath. Studio Matrx began in his notebooks — his vision of design made honest, useful, and open to everyone. Its Academy is written and taught in his memory, and free, forever.
More about Amogh →